Download
1 / 1
10 likes | 121 Vues
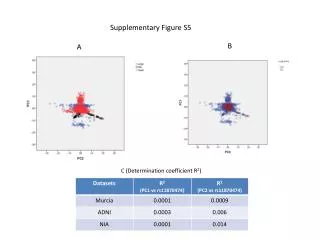
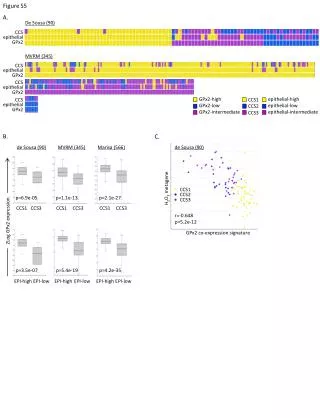
This study investigates the relationship between CCS epithelial subtypes and GPX2 expression in tumors, revealing significant correlations. The findings shed light on potential biomarkers for cancer diagnosis and treatment.

E N D
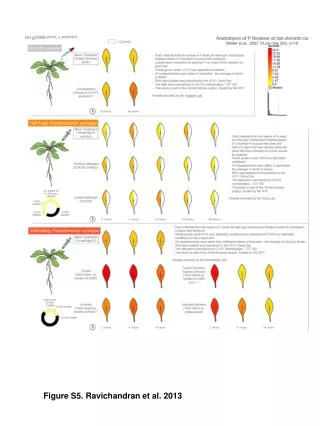
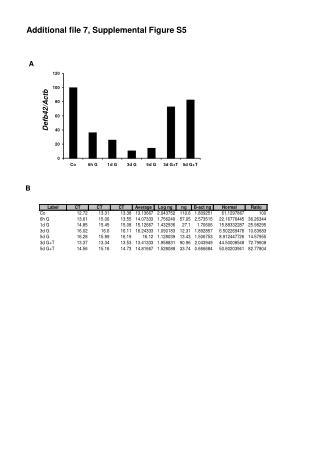
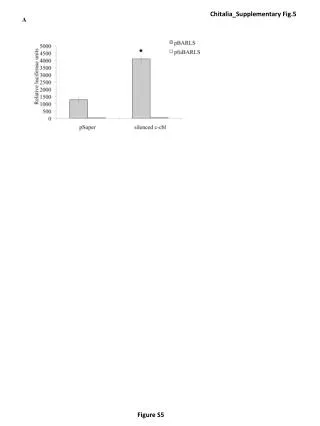
Figure S5 A. De Sousa (90) CCS CCS CCS CCS epithelial-high GPx2-high CCS1 epithelial epithelial epithelial epithelial epithelial-low GPx2-low CCS2 GPx2 GPx2 GPx2 GPx2 epithelial-intermediate GPx2-intermediate CCS3 MVRM (345) B. C. CCS1 EPI-high EPI-high EPI-high CCS1 EPI-high CCS1 CCS3 CCS3 CCS3 EPI-low EPI-low EPI-low EPI-low de Sousa (90) de Sousa (90) MVRM (345) Marisa (566) H2O2metagene p=6.9e-05 p=1.1e-13 p=2.1e-27 CCS1 CCS2 CCS3 r=-0.648 p=5.2e-12 2Log GPx2 expression GPx2 co-expression signature p=3.5e-07 p=5.4e-19 p=4.2e-35