Download
1 / 1
10 likes | 101 Vues
Explore detailed analysis of RNA and protein levels in wild-type versus knockout cells. Includes qPCR validation, histone gene expression data, and immunoblot results, shedding light on gene regulation mechanisms.

E N D
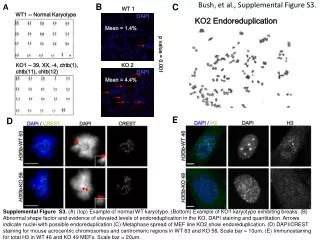
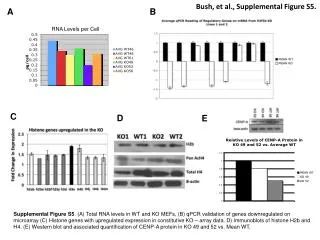
Bush, et al., Supplemental Figure S5. A B RNA Levels per Cell C D E Supplemental Figure S5. (A) Total RNA levels in WT and KO MEFs, (B) qPCR validation of genes downregulated on microarray (C) Histone genes with upregulated expression in constitutive KO – array data. D) Immunoblots of histone H2b and H4. (E) Western blot and associated quantification of CENP-A protein in KO 49 and 52 vs. Mean WT.