Download
1 / 7
70 likes | 145 Vues
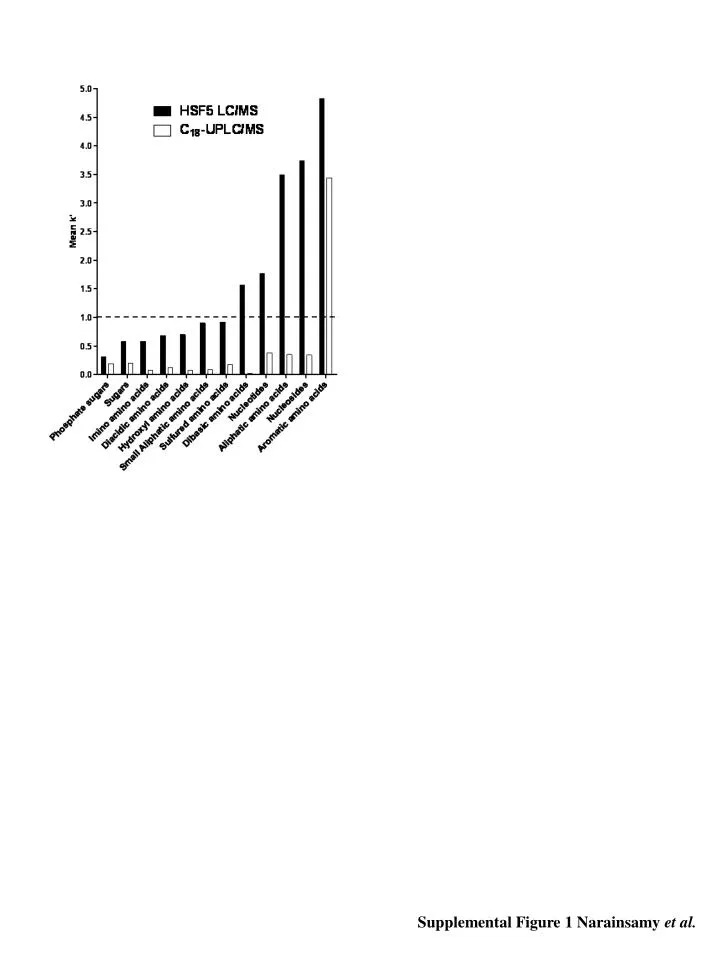
Supplemental Figure 1 Narainsamy et al. A. B. Supplemental Figure 2 Narainsamy et al. A. B. 3276. 1375. 757. 1438. Supplemental Figure 3 Narainsamy et al. B. Positive ion mode. Negative ion mode. <10. 10-25. 25-35. 35-50. >50. <10. 10-25. 25-35. 35-50. >50. CV (%).

E N D
A B Supplemental Figure 2 Narainsamy et al.
A B 3276 1375 757 1438 Supplemental Figure 3 Narainsamy et al.
B Positive ion mode Negative ion mode <10 10-25 25-35 35-50 >50 <10 10-25 25-35 35-50 >50 CV (%) CV (%) A Hexose phosphate Glucose CV: 2.3% CV: 4.9% Serine - Ureidoglycine Citrate - Isocitrate CV: 2.5% CV: 6.8% Supplemental Figure 4 Narainsamy et al.
40 000 20 000 t[2] 0 -20 000 -40 000 -60 000 -40 000 -20 000 0 20 000 40 000 60 000 t[1] R2X[1] = 0.388585 R2X[2] = 0.195294 Ellipse: Hotelling T2 (0.95) SIMCAP+ 12 Supplemental Figure 5.The impact of 3 freeze-thaw cycles of cell extracts on metabolite levels. Metabolic fingerprints of SLlG-grown Synechocystiscell extracts were recorded with the PFPP-LC-MS system operated in negative ion mode. Data were mean centered and scaled to Pareto variance before multivariate statistical analysis. The PCA scores plot for individual extracts (represented by circles, squares and triangles) does not separate the data corresponding to each unfrozen samples (white symbols) from its frozen counterparts (black symbols). Supplemental Figure 5 Narainsamy et al.
Glycolysis G Glycogen & Sucrose metabolism DHAP F1,6BP G6P G1P F6P 6-P-Gluconolactone Calvin cycle GA3P OPP RuBP 6-P-Gluconate O2 CO2 1,3-BPGA E4P CO2 GA3P R5P 3PGA X5P 2P-glycolate Ru5P S7P 2PGA C2 cycle, Glycerate and decarboxylation pathways X5P CO2 NOPP and RuBP regeneration RuBP PEP Pyruvate CO2 OOA Acetyl-CoA Malate Fumarate Citrate cis-Aconitate Glyoxylate Succinate Isocitrate Open TCA cycle CO2 2-oxoglutarate Glutamine Glutamate NH4+ Supplemental Figure 6 Narainsamy et al.
8 000 6 000 4 000 III 2 000 t[2] 0 I -2 000 II -4 000 -6 000 -8 000 -120 000 -100 000 -80 000 -60 000 -40 000 -20 000 0 20 000 40 000 60 000 80 000 100 000 120 000 t[1] R2X[1] = 0.630385 R2X[2] = 0.24088 Ellipse: Hotelling T2 (0.95) SIMCAP+12 -2010-04-30121007 (UTC+1) Supplemental Figure 7 Narainsamy et al.