Download
1 / 1
10 likes | 115 Vues
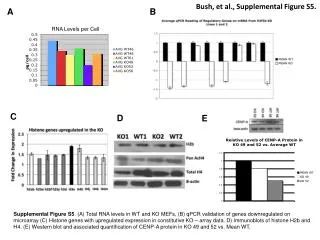
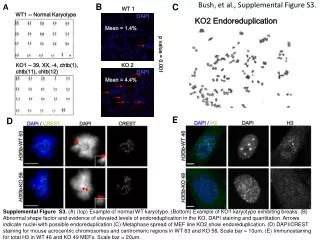
The study illustrates endoreduplication through DAPI staining in KO MEFs, presenting abnormal karyotypes and elevated endoreduplication levels compared to WT. Detailed analysis includes metaphase spread, chromosomal staining, and H3 immunostaining.

E N D
Bush, et al., Supplemental Figure S3. B A C WT 1 WT1 -- Normal Karyotype DAPI KO2 Endoreduplication Mean = 1.4% p value = 0.001 KO1 -- 39, XX, -4, chtb(1), chtb(11), chtb(12) KO 2 DAPI Mean = 4.4% E D Supplemental Figure S3. (A) (top) Example of normal WT karyotype. (Bottom) Example of KO1 karyotype exhibiting breaks. (B) Abnormal shape factor and evidence of elevated levels of endoreduplication in the KO, DAPI staining and quantitation. Arrows indicate nuclei with possible endoreduplication (C) Metaphase spread of MEF line KO2 show endoreduplication. (D) DAPI/CREST staining for mouse acrocentric chromosomes and centromeric regions in WT 63 and KO 56. Scalebar = 10um. (E) Immunostaining for total H3 in WT 46 and KO 49 MEFs. Scale bar = 20um.