Download
1 / 14
140 likes | 227 Vues
Explore the subcellular distribution, protein interactions, and gene expression profiles of OsRFP proteins in Arabidopsis. The study delves into transgenic plant responses under different stress treatments, shedding light on their role in plant growth and development.

E N D
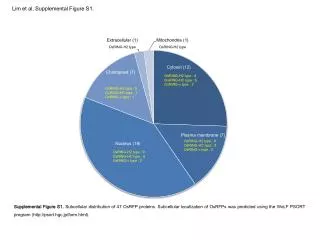
Lim et al, Supplemental Figure S1. OsRING-H2 type : 4 OsRING-HC type : 6 OsRING-v type : 2 OsRING-H2 type : 5 OsRING-HC type : 1 OsRING-v type : 1 OsRING-H2 type : 9 OsRING-HC type : 8 OsRING-v type : 2 OsRING-H2 type : 9 OsRING-HC type : 8 OsRING-v type : 2 Supplemental Figure S1. Subcellular distribution of 47 OsRFP proteins. Subcellular localization of OsRFPs was predicted using the WoLF PSORT program (http://psort.hgc.jp/form.html).
Lim et al, Supplemental Figure S2. (continued from previous page.) B
Lim et al, Supplemental Figure S2. (continued from previous page.) C
Lim et al, Supplemental Figure S2. (continued from previous page.) D
Lim et al, Supplemental Figure S2. (continued from previous page.) E F
Lim et al, Supplemental Figure S2. (continued from previous page.) G
Lim et al, Supplemental Figure S2. (continued from previous page.) Supplemental Figure S2. Proteins that positively interacted with OsRFPH2-3 (A), OsRFPH2-14 (B), OsRFPH2-16 (C), OsRFPH2-23 (D), OsRFPHC-2 (E), OsRFPHC-13 (F), or OsRFPv-6 (G) from yeast 2-hybrid screening and their predicted subcellular distributions. ‘+’ indicates cell growth on QDO/X/A (synthetic defined medium lacking Ade, His, Leu, and Trp with 40 μg/mL X-α-Gal and 70 ng/mL aureobasidin) or density of α-GAL activity (‘-’: no, ‘+’: weak, ‘++’: strong, ‘+++’: very strong). Subcellular localizations of positive interacting proteins with OsRFPs were predicted using the WoLF PSORT program (http://psort.hgc.jp/form.html).
Lim et al, Supplemental Figure S3. 35S: EGFP 35S: EGFP #1 #2 #3 #1 #2 #3 OsRFPHC-2 OsRFPH2-3 AtUBC10 AtUBC10 OsRFPH2-14 OsRFPHC-3 AtUBC10 AtUBC10 OsRFPHC-13 OsRFPH2-16 AtUBC10 AtUBC10 OsRFPv-6 OsRFPH2-23 AtUBC10 AtUBC10 Supplemental Figure S3. RT-PCR analysis of 3 independent col-0/35S:OsRFP-EGFPs T3 transgenic plants (#1, #2, and #3) and the control plant (35S:EGFP). Total RNA was extracted from 14-d-old Arabidopsis seedlings, and first-strand cDNA was synthesized using a cDNA synthesis kit (Takara-Bio, Ohtsu, Japan). Semi-quantitative RT-PCR was conducted using each gene specific primer set. The AtUBC10 (At5g25760) gene was used as an internal PCR control.
Lim et al, Supplemental Figure S4. A D B C Germination rate E H F G Germination rate Supplemental Figure S4. Germination rate of 7 overexpressed OsRFP genes in Arabidopsis. Three independent T3 seeds from 35S:OsRFPH2-3-EGFP (A), 35S:OsRFPH2-14-EGFP (B), 35S:OsRFPH2-16-EGFP (C), 35S:OsRFPH2-23-EGFP (D), 35S:OsRFPHC-2-EGFP (E), 35S:OsRFPHC-3-EGFP (F), 35S:OsRFPHC-13-EGFP (G), and 35S:OsRFPv-6-EGFP (H) with control plants (35S:EGFP) were plated on 1/2 MS. Germination percentages for each experiment were scored and calculated at 1-d intervals for 7 d. Data represent means ± SDs of 3 independent experiments (n = 3).
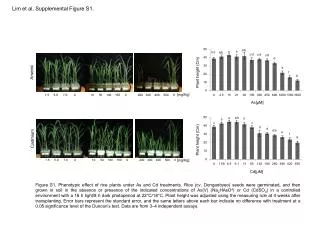
Lim et al, Supplemental Figure S5. A Mock ** ** ** * ** ** Root length (Cm) 35S:OsRFPHC-3 35S:OsRFPHC-13 35S:OsRFPHC-3 35S:OsRFPHC-13 35S:OsRFPH2-14 35S:OsRFPH2-16 35S:OsRFPH2-14 35S:OsRFPH2-23 35S:OsRFPH2-23 35S:OsRFPH2-16 35S:OsRFPHC-2 35S:OsRFPH2-3 35S:OsRFPH2-3 35S:OsRFPv-6 35S:OsRFPHC-2 35S:OsRFPv-6 35S: EGFP 35S: EGFP 35S: EGFP 35S: EGFP 35S: EGFP 35S: EGFP 35S: EGFP 35S: EGFP 35S: EGFP 35S: EGFP 35S: EGFP 35S: EGFP 35S: EGFP 35S: EGFP 35S: EGFP 35S: EGFP #1 #1 #1 #1 #1 #1 #1 #1 #1 #1 #1 #1 #1 #1 #1 #1 #2 #2 #2 #2 #2 #2 #2 #2 #2 #2 #2 #2 #2 #2 #2 #2 #3 #3 #3 #3 #3 #3 #3 #3 #3 #3 #3 #3 #3 #3 #3 #3 B 100 mM NaCl ** ** ** ** ** ** ** ** ** ** ** ** ** ** * ** ** ** ** * Root length (Cm)
Lim et al, Supplemental Figure S5. (Continued from previous page.) C -0.5 MPa PEG ** ** ** ** ** ** ** ** ** * ** ** ** ** ** ** ** ** ** ** ** Root length (Cm) 35S:OsRFPHC-3 35S:OsRFPHC-13 35S:OsRFPH2-23 35S:OsRFPH2-14 35S:OsRFPH2-16 35S:OsRFPHC-2 35S:OsRFPH2-3 35S:OsRFPv-6 35S: EGFP 35S: EGFP 35S: EGFP 35S: EGFP 35S: EGFP 35S: EGFP 35S: EGFP 35S: EGFP #1 #1 #1 #1 #1 #1 #1 #1 #2 #2 #2 #2 #2 #2 #2 #2 #3 #3 #3 #3 #3 #3 #3 #3 Supplemental Figure S5. Root length assay for 8 overexpressed OsRFP genes in Arabidopsis under 100 mM NaCl and -0.5 MPa PEG treatments. Three independent seeds from 35S:OsRFPH2-3-EGFP, 35S:OsRFPH2-14-EGFP, 35S:OsRFPH2-16-EGFP, 35S:OsRFPH2-23-EGFP, 35S:OsRFPHC-2-EGFP, 35S:OsRFPHC-3-EGFP, 35S:OsRFPHC-13-EGFP, and 35S:OsRFPv-6-EGFP with control plants (35S:EGFP) were plated on 1/2 MS, and germinated seeds were transferred 1/2 MS (A) or 1/2 MS containing 100 mM NaCl (B) or -0.5 MPa PEG (C). The root lengths of each transgenic plant and control plant were photographed after 7 d and analyzed using Image J software. Data represent means ± SDs of 3 independent experiments (n = 30). ‘*’ and ‘**’ indicate significant differences of overexpressing transgenic lines in comparison to the control at p < 0.05 and p < 0.01, respectively (Student’s t -test).
Lim et al, Supplemental Figure S6. 35S:OsRFPH2-3 35S: EGFP #2 #3 #1 35S:OsRFPH2-16 35S:OsRFPH2-14 35S: EGFP 35S:OsRFPH2-23 35S: EGFP 35S: EGFP #2 #3 #1 #2 #3 #1 #2 #3 #1 35S:OsRFPHC-13 35S:OsRFPHC-2 35S: EGFP 35S:OsRFPv-6 35S: EGFP 35S:OsRFPHC-3 35S: EGFP 35S: EGFP #2 #3 #1 #2 #3 #1 #2 #3 #1 #2 #3 #1 Supplemental Figure S6. H2O2 production in response to dehydration stress. Detached rosette leaves from 2-week-old control (35S:EGFP) and transgenic lines (35:OsRFP-EGFPs) were treated with dehydration for 90 min. Indicated leaf samples were incubated with 1 mg/mLDAB solution for 4 h, after which the solution was replaced with bleaching solution. Induced H2O2 production was visualized as a dark brown color.
Lim et al, Supplemental Figure S7. 35S: EGFP 35S: OsRFPH2-16 #1 35S: EGFP 35S: OsRFPH2-14 #3 35S: EGFP 35S: OsRFPH2-23 #1 35S: EGFP 35S: OsRFPH2-3 #2 Survival rate (%) 14 days with water 14 days with water 4% (3/75) 67.6% (48/71) 7% (5/71) 49.3% (37/75) 10.2% (8/78) 35.8% (28/78) 6.7% (5/74) 47.9% (35/73) 10 days without water 10 days without water 35S: EGFP 35S: OsRFPHC-2 #1 35S: EGFP 35S: OsRFPHC-3 #2 35S: EGFP 35S: OsRFPHC-13 #1 35S: EGFP 35S: OsRFPv-6 #3 5 days after rewatering 5 days after rewatering Survival rate (%) 8.0% (6/75) 30.6% (23/75) 2.6% (2/75) 23% (18/78) 7.5% (6/79) 58.9% (43/73) 4.2% (2/74) 16% (12/75) Supplemental Figure S7. Increased water tolerance of overexpressed OsRFP genes in Arabidopsis. Overexpression of OsRFPH2-3-EGFP, OsRFPH2-14-EGFP, OsRFPH2-16-EGFP, OsRFPH2-23-EGFP, OsRFPHC-2-EGFP, OsRFPHC-3-EGFP, OsRFPHC-13-EGFP, and OsRFPv-6-EGFP in Arabidopsis conferred tolerance to drought stress. Fourteen-day-old control (35S:EGFP) and transgenic lines were grown for 10 days without irrigation. Survival rates were measured at 5 days after rewatering.