Download
1 / 6
60 likes | 159 Vues
A. 5’UTR. CR. 3’UTR. MKP-1. 1. 249. 2015. 1352. CR. 3’UTR. 5’UTR. MKP-1. GAPDH. B. 5’UTR CR 3’UTR 3’UTR. RNA :. H 2 O 2 (h) : 0 1 2 0 1 2 0 1 2 0 1 2. HuR NF90.

E N D
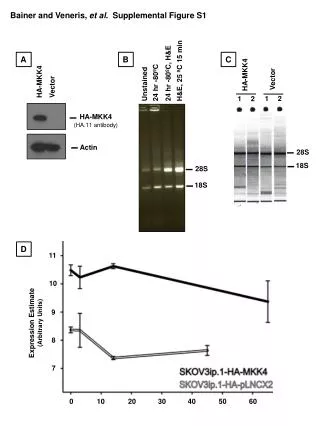
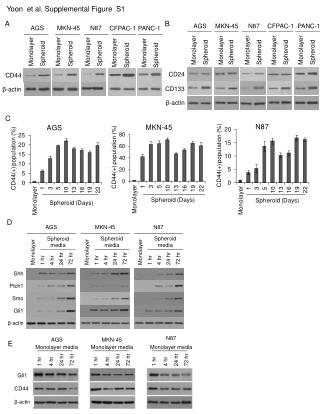
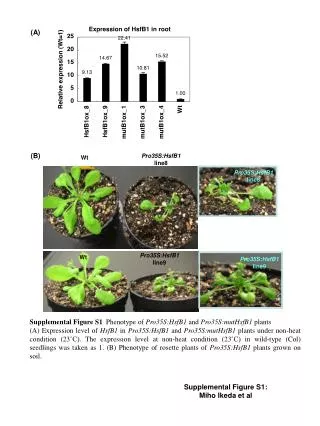
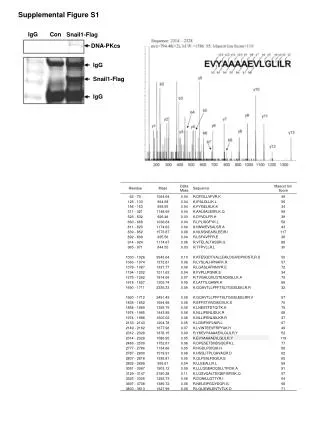
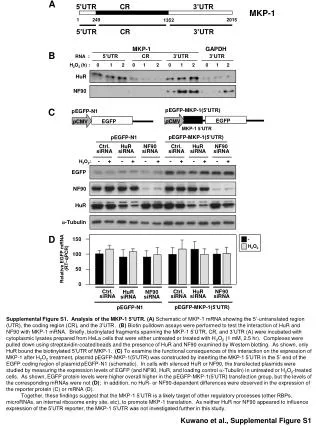
A 5’UTR CR 3’UTR MKP-1 1 249 2015 1352 CR 3’UTR 5’UTR MKP-1 GAPDH B 5’UTR CR 3’UTR 3’UTR RNA : H2O2 (h) : 0 1 2 0 1 2 0 1 2 0 1 2 HuR NF90 C 150 Ctrl. siRNA HuR siRNA NF90 siRNA Ctrl. siRNA HuR siRNA NF90 siRNA 100 H2O2: - + - + - + - + - + - + EGFP NF90 HuR -Tubulin 50 0 pEGFP-MKP-1(5’UTR) pEGFP-N1 EGFP EGFP pCMV pCMV MKP-1 5’UTR D - H2O2 Relative EGFP mRNA (RT–qPCR) Ctrl. siRNA Ctrl. siRNA HuR siRNA NF90 siRNA HuR siRNA NF90 siRNA pEGFP-MKP-1(5’UTR) pEGFP-N1 pEGFP-MKP-1(5’UTR) pEGFP-N1 Supplemental Figure S1. Analysis of the MKP-1 5’UTR. (A) Schematic of MKP-1 mRNA showing the 5’-untranslated region (UTR), the coding region (CR), and the 3’UTR. (B) Biotin pulldown assays were performed to test the interaction of HuR and NF90 with MKP-1 mRNA. Briefly, biotinylated fragments spanning the MKP-1 5’UTR, CR, and 3’UTR (A) were incubated with cytoplasmic lysates prepared from HeLa cells that were either untreated or treated with H2O2 (1 mM, 2.5 hr). Complexes were pulled down using streptavidin-coated beads and the presence of HuR and NF90 examined by Western blotting. As shown, only HuR bound the biotinylated 5’UTR of MKP-1. (C) To examine the functional consequences of this interaction on the expression of MKP-1 after H2O2 treatment, plasmid pEGFP-MKP-1(5’UTR) was constructed by inserting the MKP-1 5’UTR in the 5’ end of the EGFP coding region of plasmid pEGFP-N1 (schematic). In cells with silenced HuR or NF90, the transfected plasmids were studied by measuring the expression levels of EGFP (and NF90, HuR, and loading control -Tubulin) in untreated or H2O2-treated cells. As shown, EGFP protein levels were higher overall higher in the pEGFP-MKP-1(5’UTR)transfection group, but the levels of the corresponding mRNAs were not (D); in addition, no HuR- or NF90-dependent differences were observed in the expression of the reporter protein (C) or mRNA (D). Together, these findings suggest that the MKP-1 5’UTR is a likely target of other regulatory processes (other RBPs, microRNAs, an internal ribosome entry site, etc), to promote MKP-1 translation. As neither HuR nor NF90 appeared to influence expression of the 5’UTR reporter, the MKP-1 5’UTR was not investigated further in this study. Kuwano et al., Supplemental Figure S1
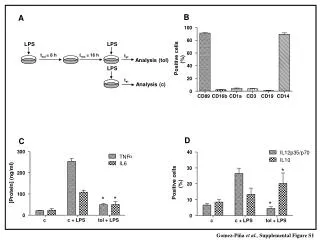
3’UTR A B C CR A MKP-1 5’UTR CR 3’UTR 1 249 2015 1352 CR 3’UTR A B C B RNA: CR 3’UTR GAPDH CR 3’UTR GAPDH H2O2: - + - + - + - + - + - + HuR AUF1 NF90 TIA-1 TIAR Reaction supernatant Beads C RNA: H2O2: - + - + - + - + - + HuR NF90 Supplemental Figure S2. Location and H2O2-dependent binding of RBPs to biotinylated MKP-1 transcripts.(A) Schematic of the MKP-1 mRNA showing the coding region (CR) and the 3’-untranslated region (UTR). Biotinylated transcripts spanning the CR and full length (3’UTR) or partial (A, B, C) segments were prepared for biotin pulldown analysis. (B) Cytoplasmic lysatesprepared from HeLa cells that were either left untreated or treated with H2O2 (1 mM, 2.5 hr) were incubated with the biotinylated transcripts indicated. The ribonucleoprotein complexes were pulled down using streptavidin-coated beads and the presence of the RBPs indicated was tested by Western blot analysis (‘Beads’); aliquots of the ‘Reaction supernatant’ were examined in parallel. (C) The MKP-1 3’UTR was subdivided and biotin pulldown analysis performed to in order to test the relative binding of NF90 and HuR to each segment. As shown, both HuR and NF90 showed the greatest binding to biotinylated fragment C, both showed weak binding to transcript A and both showed potent H2O2-dependent binding to fragment B. The significance of this interaction pattern will be pursued elsewhere. Kuwano et al., Supplemental Figure S2
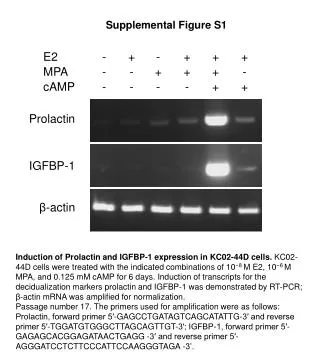
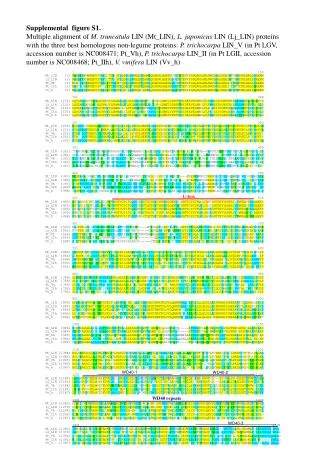
A H2O2- + p-Akt Akt GAPDH B IP: IgG NF90 H2O2 (h) 0 1 4 0 1 4 • 100 kDa - • 50 kDa - - NF90 WB: phospho-Serine Supplemental Figure S3. NF90 serine phosphorylation. HeLa cells were either left untreated or treated with H2O2 (1 mM). (A) One hour later, the levels of total Akt and phosphorylated Akt were assessed by Western blot analysis using anti-Akt and anti-phospho (p)-Akt antibodies (Cell Signaling); GAPDH was measured as loading control. (B) Lysates were prepared 1 and 4 hr after H2O2 treatment and used in IP reactions with IgG or anti-NF90 antibodies. Serine phosphorylation in the IP reaction products was detected by Western blot analysis of the IP reactions using anti-phospho-Serine antibody (Cell Signalling). Kuwano et al., Supplemental Figure S3
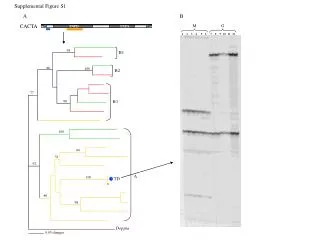
A Untr. H2O2 6 4 MKP-1 mRNA in TAP-IP (relative levels) 2 0 TAP HuR (WT) TAP HuR (S88A) TAP HuR (S100A) TAP HuR (T118A) TAP B TAP-HuR HuR -Actin H2O2 - + - + - + - + - + - + TAP TAP HuR (WT) TAP HuR (S88A) TAP HuR (S100A) TAP HuR (T118A) TAP Control siRNA HuR 3’UTR siRNA Supplemental Figure S4. Influence of HuR mutation on S88, S100, T118 on the association of HuR with MKP-1 mRNA. (A) HeLa cells were transfected with plasmids expressing either wild type (WT) HuR or HuR carrying mutations S88A, S100A or T118A (all TAP-tagged proteins). HeLa cells were simultaneously transfected with HuR siRNA targetting the HuR 3’UTR (to which the ectopic HuR-TAP transcripts were refractory). Forty-eight h after transfection, cells were treated with 1 mM H2O2 and collected 3 h later. The association of each fusion protein to MKP-1 mRNA before and after H2O2 treatment was tested by TAP-IP. (B) The levels of ectopic HuR-TAP proteins as well as endogenous HuR are shown. The siRNA targeting the HuR 3’UTR reduced HuR levels only modestly; therefore, the effect of expressing HuR mutants (S88A, S100A, T118A) on MKP-1 production could not be tested. Kuwano et al., Supplemental Figure S4
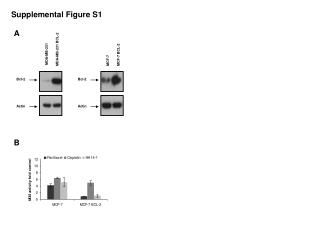
A B pHuR- -TAP Ctrl. siRNA HuR siRNA MKP-1 siRNA Vector H2O2 0 3 6 0 3 6 H2O2 (h) 0 1 3 0 1 3 0 1 3 p-JNK p-ERK p-38MAPK MKP-1 HuR -Actin Tap-HuR HuR Cleaved Caspase-9 Cleaved PARP -Actin D B Ctrl. siRNA MKP-1 siRNA pGFP- -MKP-1 Vector Cleaved Caspase-9 Cleaved PARP -Actin GFP Cleaved Caspase-9 Cleaved PARP -Actin H2O2 (h) 0 3 6 0 3 6 H2O2 (h) 0 3 12 0 3 12 Supplemental Figure S5. Influence of MKP-1 on H2O2-induced apoptotic markers. (A, B) HeLa cells were transfected with control (Ctrl.), HuR-directed or MKP-1-directed siRNA; 48 h later, cells were either treated with H2O2 (1 mM) or left untreated (-) and were collected for Western blot analysis at the times shown. The phosphorylation of ERK1/2, p38 MAPK, and JNK (A), as well as cleavage of caspase-9 and PARP signals were monitored thereafter (B). (C) HeLa cells were transfected with pHuR-TAP (26), treated with H2O2 for the times shown, and HuR-TAP, HuR, as well as cleaved caspase-9 and PART were tested by Western blot analysis. (D) HeLa cells were transfected with plasmid pGFP-MKP-1 (obtained from Addgene), treated with H2O2, and the levels of GFP-MKP-1 (GFP), cleaved caspase-9, and cleaved PARP were visualized by Western blot analysis. In all cases, -Actin served as loading control. Kuwano et al., Supplemental Figure S5
120 100 80 60 40 20 0 A 120 Untr. H2O2 100 80 % Cell Survival (500 M H2O2, 1 h) 60 40 20 0 Vector pHuR- -TAP Vector pHuR- -TAP Ctrl. siRNA MKP-1 siRNA B Untr. H2O2 % Cell Survival (500 M H2O2, 1 h) Vector Vector pGFP- -MKP-1 pGFP- -MKP-1 Ctrl. siRNA HuR siRNA Supplemental Figure S6. Influence of MKP-1 on H2O2-reduced cell survival. HeLa cells were transfected as explained in Supplemental Figure S5, then treated with 0.5 mM H2O2 and cell survival was measured by the MTT assay 24 h later. (A) Effect of overexpressing HuR in the presence of normal or reduced MKP-1 levels. (B) Effect of overexpressing MKP-1 in the presence of normal or reduced HuR levels. The data are the means and S.E.M. from three independent experiments. Kuwano et al., Supplemental Figure S6