Download
1 / 5
50 likes | 181 Vues
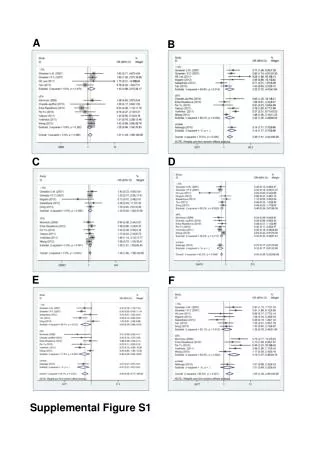
Lim et al, Supplemental Figure S1. . a/b. a. a. b/c. a/b. c/d. c/d. c/d. d. e. Arsenic. Plant height (Cm). f. g. [mg/Kg]. 1.5. 5.0. 7.0. 0. 10. 50. 100. 150. 0. 200. 300. 400. 500. 0. As[ μ M]. Cadmium. a/b. a. b. b. c. c. d. d. d/e. e. f. g.

E N D
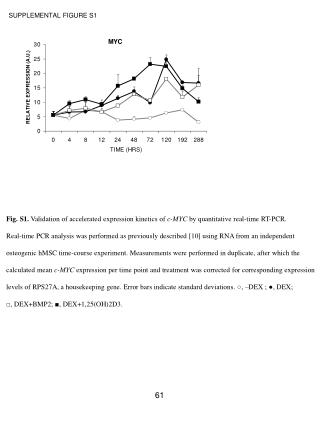
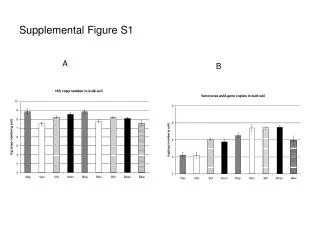
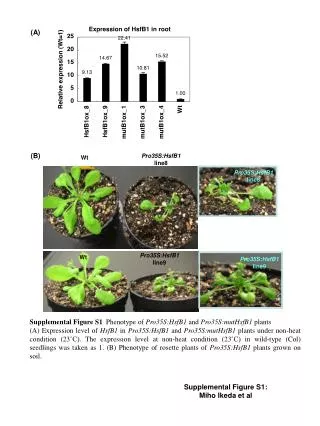
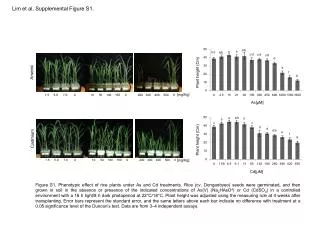
Lim et al, Supplemental Figure S1. a/b a a b/c a/b c/d c/d c/d d e Arsenic Plant height (Cm) f g [mg/Kg] 1.5 5.0 7.0 0 10 50 100 150 0 200 300 400 500 0 As[μM] Cadmium a/b a b b c c d d d/e e f g Plant height (Cm) 1.5 5.0 7.0 0 10 50 100 150 0 200 300 400 500 0 [mg/Kg] Figure S1. Phenotypic effect of rice plants under As and Cd treatments. Rice (cv. Donganbyeo) seeds were germinated, and then grown in soil in the absence or presence of the indicated concentrations of As(V) (Na2HAsO4) or Cd (CdSO4) in a controlled environment with a 16 h light/8 h dark photoperiod at 22°C/18°C. Plant height was adjusted using the measuring rule at 4 weeks after transplanting. Error bars represent the standard error, and the same letters above each bar indicate no difference with treatment at a 0.05 significance level of the Duncan’s test. Data are from 3–4 independent assays. Cd[μM]
Lim et al, Supplemental Figure S2. 1 0.5 0 -0.5 Hydrophobicity index -1 -1.5 -2 -2.5 a.a. 0 50 100 150 200 250 300 350 400 Figure S2. Hydropathy plot of the predicted OsHIR1 protein sequence. The hydropathy plot (mean values for a window of 17 amino acids) was elaborated using the Kyte–Doolittle (KD) hydrophobicity index (http://web.expasy.org/protscale/).
Lim et al, Supplemental Figure S3. 35S:OsHIR1-EYFP 35S:EYFP # 1 # 11 # 12 AtUBC21 OsHIR1 Figure S3. Semi-quantitative RT-PCR of OsHIR1-overexpressing Arabidopsis and control plants. Total RNAs from 2-week-old seedlings of 35S:OsHIR1-EYFP and 35S:EYFP (empty vector) T3 transgenic plants were used for RT-PCR. AtUBC21 was used for the internal control.
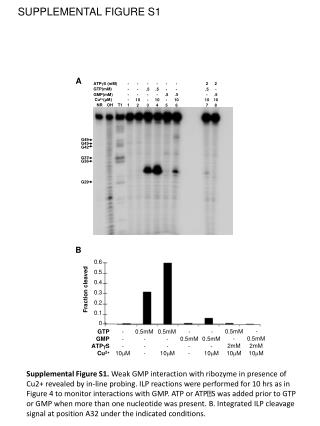
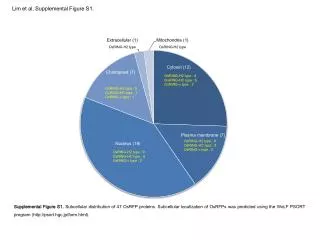
Lim et al, Supplemental Figure S4. Figure S4. Positive interacting substrate proteins of the OsHIR1 RING E3 ligase. A yeast two-hybrid screening and their predicted subcellular distribution are presented. “+” indicates cell growth on QDO/X/A or density of α-GAL activity (“+,” weak; “++,” strong; “+++,” very strong). Subcellular localizations of positive interacting proteins with OsHIR1 were predicted using the WoLF PSORT program (http://psort.hgc.jp/form.html).
Lim et al, Supplemental Figure S5. 35S::OsHIR1-EGFP /35S::OsTIP4;1-EGFP 35S::OsTIP4;1-EGFP A B 35S::EGFP OsTIP4;1 OsHIR1 Nt18SrRNA • Figure S5. Coexpression of OsHIR1 and OsTIP4;1in N. benthaminanaleaves. A, Semi-quantitative RT-PCR was conducted to evaluate expression level of OsTIP4;1 in the present or present of OsHIR1 or. Each Agrobacterium (GV3101) containing the35S:OsHIR1-EGFP and 35S:OsTIP4:1-EGFP was transiently co-expressed in N. benthamiana leaves. The 35S:EGFP construct was used as negative control and the Nt18S rRNAgene was used as a internal control. B, The volume integration value of 35S:OsTIP4;1. Autoradiographs were digitized using a Bio-Rad Gel Doc XR+ system. The volume integration value for each band was determined after subtraction of local background by using Molecular Analyst Software (Bio-Rad) version 5.0. Bar indicates standard error of three replicate experiments.