Dose-Dependent Effects of Adenoviral STAT3 Dominant Negative on pSTAT3 and Apoptosis in MDA-MB-231 Cells
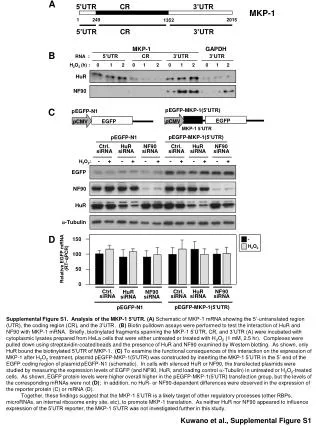
This study investigates the impact of adenoviral STAT3 dominant negative on phosphorylated STAT3 (pSTAT3) levels in MDA-MB-231 cells, revealing a dose-dependent decrease in pSTAT3, with detectable levels almost absent at a multiplicity of infection (MOI) of 15. FLAG-tagged STAT3 dominant negative increased with elevated MOIs. Apoptosis was evaluated through cleaved PARP and caspase-3 detection, showing no apoptosis in cells treated with adenoviral STAT3 dominant negative or GFP control, while NIH/3T3 cells treated with staurosporine exhibited confirmed apoptotic activity.

Dose-Dependent Effects of Adenoviral STAT3 Dominant Negative on pSTAT3 and Apoptosis in MDA-MB-231 Cells
E N D
Presentation Transcript
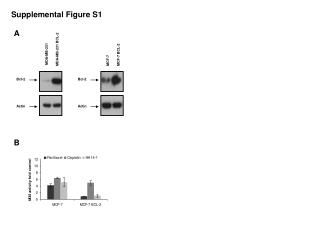
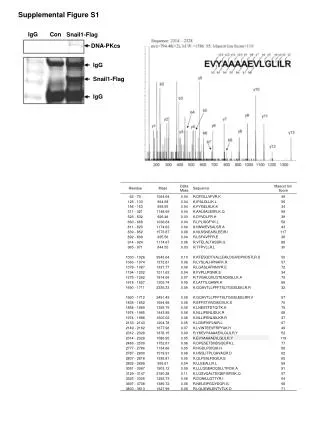
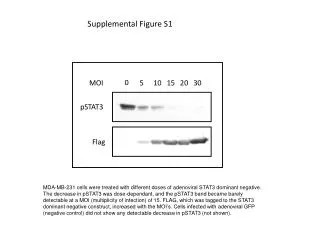
Supplemental Figure S1 0 MOI 5 10 15 20 30 pSTAT3 Flag MDA-MB-231 cells were treated with different doses of adenoviral STAT3 dominant negative. The decrease in pSTAT3 was dose-dependant, and the pSTAT3 band became barely detectable at a MOI (multiplicity of infection) of 15. FLAG, which was tagged to the STAT3 dominant negative construct, increased with the MOI’s. Cells infected with adenoviral GFP (negative control) did not show any detectable decrease in pSTAT3 (not shown).
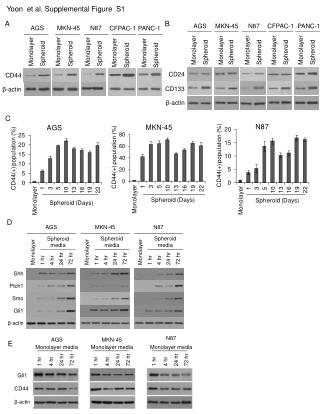
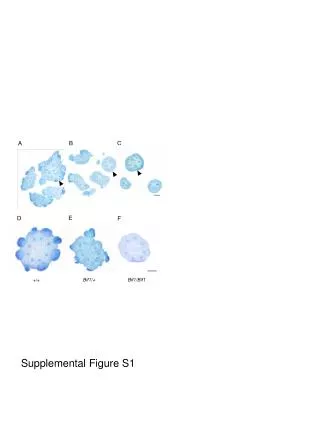
Supplemental Figure S2 Adenoviral STAT3 dominant negative Adenoviral GFP Control 0 0 5 10 15 20 30 5 10 15 20 30 MOI MW (kDa) PARP 116 89 Cleaved PARP Caspase 3 35 19 Cleaved caspase 3 17 MDA-MB-231 cells were infected with adenoviral STAT3 dominant negative at different MOI’s. After 48 hours, apoptosis was assessed by detecting cleavage of caspase 3 and PARP. MDA-MB-231 cells showed no sign of apoptosis after the treatment. MDA-MB-231 cells treated with adenoviral GFP (a negative control) showed no detectable evidence of apoptosis. NIH/3T3 cells treated with 1 µM staurosporine served as a positive control.