
Quadratic Function Analysis and Maximum Value Calculation
E N D
Presentation Transcript
Logical Functions and Control Structures Chapter 8
Acknowledgement • Some slides are taken from www.cs.cornell.edu/courses/cs100m/2007fa
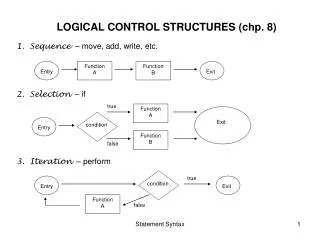
Sequence Selection Repetition (Loop) Sequence Selection Repetition Structures
b = input(‘Enter b:’) c = input(‘Enter c:’) L = input(‘Enter L:’) R= input(‘Enter R:’)
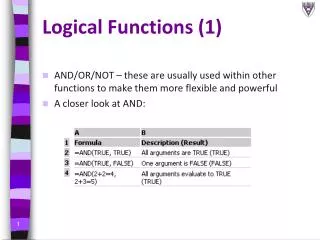
Problem 1 Write a function that accepts b, c, L and R and prints “yes” if the quadratic function increases across the interval and “no” if it does not.
Function Fragment function Problem1(b,c,L,R)
Problem 2 Write a function that accepts b, c, L and R and prints the maximum value that the quadratic function q(x)=x2 + bx +c on the interval L <= x <= R.
Function Fragment function maxVal = Problem2(b,c,L,R)
Problem 3 Write a function that accepts b, c, L and R and prints “yes” if xc is in the interval and “no” if xc is not in the interval.
Function Fragment function Problem3(b,c,L,R)
Another Function Fragment function Problem3(b,c,L,R)
Relational Operators < Less than <= Less than or equal to > Greater than >= Greater than or equal to == Equal to ~= Not equal to
Logical Operators & and ~ not | or xor exclusive or
Pseudo-code Example • You’ve been asked to create a program to convert miles/hr to ft/s. The output should be a table, complete with title and column headings
Outline the steps • Define a vector of mph values • Convert mph to ft/s • Combine the mph and ft/s vectors into a matrix • Create a table title • Create column headings • Display the table
Flow Charting • Create a big picture graphically • Convert to pseudo-code
This flowchart represents the mph to ft/s problem Start Define a vector of miles/hour Calculate the ft/sec vector Combine into a table Create an output table using disp and fprintf End
An oval indicates the beginning of a section of code A parallelogram indicates an input or output A diamond indicates a decision point Calculations are placed in rectangles Simple Flow Chart Symbols
Another Example • Naval Academy requires applicants to be at least 5’6” tall • Consider this list of applicant heights • 63”, 67”, 65”, 72”, 69”, 78”, 75” • Which applicants meet the criteria?
index numbers element values
By combining relational and logical operators you can create fairly complicated search criteria • Assume applicants must be at least 18 years old and less than 35 years old • They must also meet the height requirement
Applicant pool Height Age Inches years 63 18 67 19 65 18 72 20 69 36 78 34 75 12
Start Sorry – You’ll have to wait True if age<16 elseif You may have a youth license True age<18 elseif You may have a standard license True age<70 else Drivers over 70 require a special license End
Section 8.5Repetition Structures - Loops • Loops are used when you need to repeat a set of instructions multiple times • MATLAB supports two types of loops • for • while
You’ve run out of values in the index matrix Check to see if the index has been exceeded Flow chart for a for loop Calculations
For Loops for index = 1:n % index=[matrix] commands to be executed end The loop is executed once for each element of the index matrix identified in the first line