
Analyzing Stream Condition Using EMAP Algae Data
E N D
Presentation Transcript
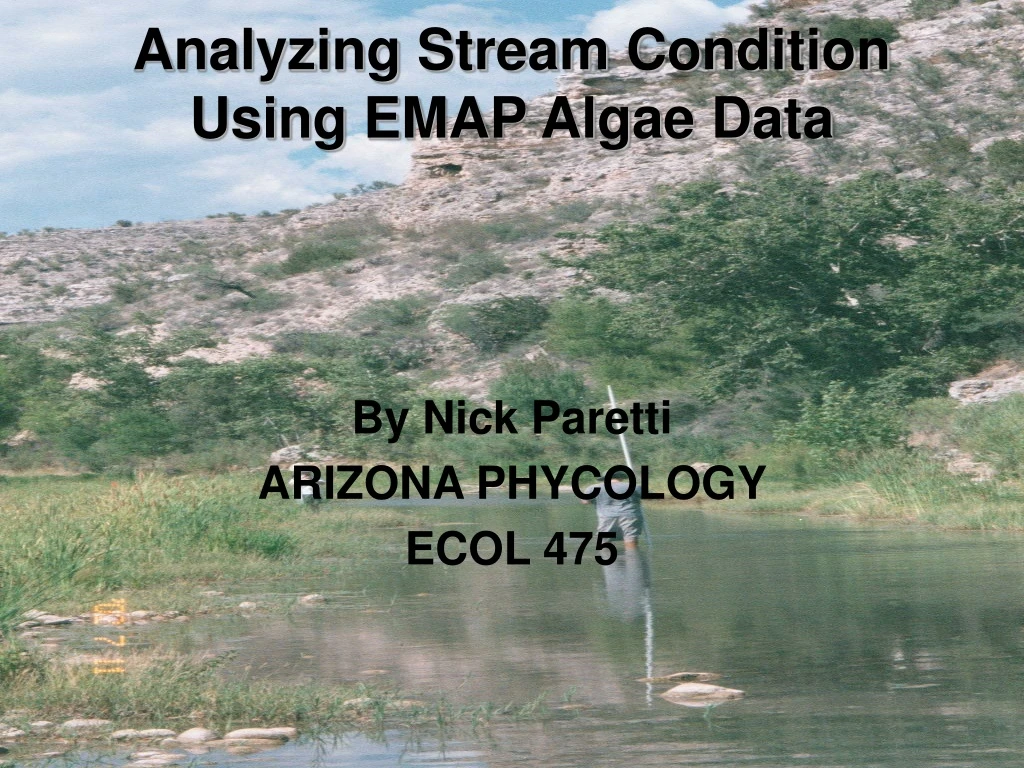
Analyzing Stream Condition Using EMAP Algae Data By Nick Paretti ARIZONA PHYCOLOGY ECOL 475
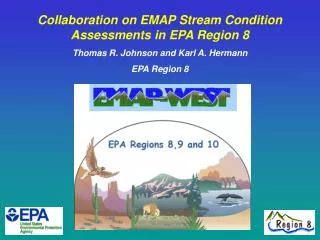
U.S. Environmental Protection Agency Environmental Monitoring and Assessment Program (EMAP) • The EMAP Western Pilot Study requires a representative sample of biotic assemblages along with physical and chemical measures across 12 western states • The sampling consists of the five following components: water chemistry, physical habitat, periphyton assemblage, benthic macroinvertebrate assemblage, and aquatic vertebrate assemblage. • The data will be used to generate state and regional scale assessments of the condition of ecological resources in the western United States, and to identify stressors associated with the degradation of these resources.
Questions to Answer • EPA • What proportion of stream and river miles in the western U.S. are in acceptable (or poor) biological condition? • What is the relative importance of potential stressors (habitat modification, sedimentation, nutrients, temperature, grazing, timber harvest, etc.) in streams and rivers across the West? • This project • Use a random subset of data (n=168) • Statistical analyses Oneway ANOVA and simple regression • Determine if algae can be used as an indicator of stream condition
Cladophora • Chlorophyte (Green Algae) • Chlorophylls a and b Xanthans and Carotenoids • Filamentous • Habitat for Macroinvertebrate • Fish cover for young • Food source
Microcystis • Cyanobacteria (blue-green algae) • Unicellular clusters • Nitrogen fixation • Chlorophyll a and phycobilins • Indicator of eutrophication • Lacking a membrane-bounded nucleus • Wide range of temperatures
EMAP Protocol • Randomly selected Site • Reach 40 X channel width • 11 transects • Canopy cover • Densiometer • Six measurements are obtained at each cross-section transect • Measurements in four directions at mid-channel and one at each bank • Water body character • Assign a rating of 1 (highly disturbed) to 5 (pristine) based on your • 5. Beautiful, could not be any nicer. • 4. Very minor aesthetic problems; excellent for swimming, boating, enjoyment. • 3. Enjoyment impaired. • 2. Level of enjoyment substantially reduced. • 1. Enjoyment nearly impossible.
Canopy Cover • Riparian canopy cover • Stream temperatures • Shading / Light penetration • Inputs of coarse and fine particulate organic material • Organic inputs are food for stream organisms
1 0.9 0.8 0.7 Percent Algae 0.6 0.5 0.4 0.3 0.2 0.1 0 0 .1 .2 .3 .4 .5 .6 .7 .8 .9 1 Canopy Cover Relation of Canopy • Negative Relationship • Less light • Less photosynthesis • Less primary productivity R-square .04 F-ratio <.0001 N=168
Dominant Land Use • Algal biomass as an indicator of nutrient enrichment • Problems related to excessive nutrient enrichment • Eutrophication • Algal blooms • Depletion of Oxygen • Suburban/ town • Human activities, fertilizer application, burning of fossil fuels • Range • Animal Waste • Agriculture • Eutrophic • Fertilizers • Forested streams • Oligotrophic • Leaf litter
Dominant Land Use Prob > F 0.0686 Prob > F 0.0024 • Oneway ANOVA • Analyzing percent algae • The Forest dominated stream is statistically different than Range and Suburban/town • Statistically level 5 of Pristine is different than level 1 • Trends
Nutrients • Water Chemistry • Inconclusive evidence comparing percent algae to Nutrient concentrations • Selected chemicals • NO3, DOC, DIC, NH4, total phosphorus, total nitrogen (dissolved inorganic and organic nitrogen and articulate organic and inorganic nitrogen, minus N2 gas) • The forest dominated stream is statistically different than the agriculture dominated stream
20 15 100 Dic DOC 10 5 0 0 Agriculture Forest Range Suburban/Town Agriculture Forest Range Suburban/Town t 0.05 0.05 Dominant Land use Dominant land use 16000 500 14000 12000 400 10000 300 8000 No3 Ptl 6000 200 4000 100 2000 0 0 -2000 Agriculture Forest Range Suburban/Town Agriculture Forest Range Suburban/Town Dlanduse Dlanduse Nutrients
Stream Order • Increased Velocity • Increased Volume • Increased Inputs • Organic Matter • Human Influences • Fertilizers • Nutrient Load • More Algae • Blooms • Analyzing percent algae • A first order stream is statistically different than a seventh order stream • Trends
1.1 1 0.9 0.8 0.7 Percent Algae 0.6 0.5 0.4 0.3 0.2 0.1 0 -0.1 1 2 3 4 5 7 Stream Order Stream Order Prob > F 0.0119
Conclusions • Algae as a biological indicator • Identify algae • Identify stressors associated with the degradation of stream habitat • Canopy Cover • Dominant Land use • Aesthetic appeal • Nutrients • Stream Order • Interpret the data and apply it to vertebrate communities and restoration • Produce unbiased estimates of the ecological condition of surface waters across a large geographic area (or areas) of the West