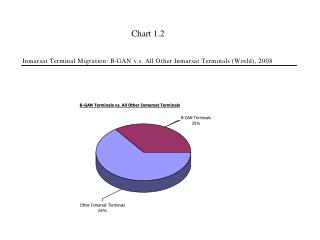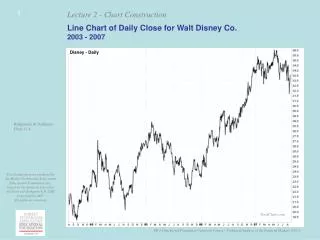
Line - Chart
Line - Chart. Candlestick chart. A trend line with triangles.

Line - Chart
E N D
Presentation Transcript
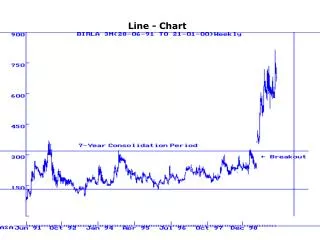
Trend-linesTrend-lines joins two important tops/bottoms on price chart to show the trend of price movements. Trend continues as long as the trend-line provides the support or resistance. Breaking of a trend-line suggests reversal of trend. Often, "throwbacks" may also be given after a trend-line is broken. Trend-line channels can also be drawn to see a channeled movement of prices. Trend-lines & channels and their breaks provide excellent entry & exit points for an investor.
GapsPrice gaps show buying or selling pressures. Price chart can break from congestion with "Break-out" gaps, continue with "Runaway" gaps and end with "exhaustion" gap. Gaps prove to be useful support & resistance levels in future.
Moving AveragesPrice chart crossing its Moving Average gives Buy (crossing from below) and Sell (crossing from above) signals. Instead, signals generated by a lower-period moving average cutting a higher-period moving average, also can be used to get good entry/exit signals.
PatternsAn Uptrend starts and continues with "higher tops and higher bottoms" pattern. A Downtrend starts and continues with "lower tops and lower bottoms" pattern. Patterns like Double-top, Double-bottom, Island Reversal, Bar Reversal, Head & Shoulder formation, Rounding-bottom formation, etc. are very good reversal patterns suggesting a change in price direction. Patterns like Flags, Triangles, Falling-Rising Wedges are good continuation patterns
OscillatorsOscillators provide computerised mechanical signals to buy or sell. ROC, RSI, Stochastics, MACD etc. are price-based oscillators while others are advance-decline-ratio-based oscillators. OBV is an example of volume-based oscillators. All oscillators oscillate from overbought to oversold zone and vice versa. Oscillator cutting their own moving average in oversold/overbought zones provide very good buy/sell signals. In addition, one may also look at positive/negative divergence.
Retracement LevelsRetracement means correction to a move. 61.8%, 50%, 38.2% are some of the most observed "retracement" levels for any move. These studies can give you exact values to enter or exit a stock
Elliott Wave Analysis Named after R.N.Elliott, the inventor, the Wave analysis basically studies whether a price move is "Impulsive" or "Corrective" and has definite rules to project future price movements. Every "Impulse" has 5 internal waves and a "Corrective" has 3. An Impulse is followed by Corrective and vice versa. Elliott Wave Analysis,
Fibonacci Numbers and RatiosFibonacci Number Series starts with numbers 1 & 2, and further numbers are simply addition of the previous two numbers. Thus, it is an infinite Number Series which goes like : 1, 2, 3, 5, 8, 13, 21, 34, 55, 89, 144, 233, 377 .. & so on. Each Fibonacci Number (except the initial few) is exactly 61.8% of the next, and 38.2% of the next-to-next number. Similarly, each Fibonacci Number is exactly 161.8% of the previous and 261.8% of the previous-to-previous number. These Numbers, as well as the ratios based on them, are very important for Technical Analysis, especially for those doing Time Analysis or Elliott Wave Analysis. Many moves continue exactly for Fibonacci Number of days. Many corrections (Pricewise / timewise) are exactly some Fibonacci ratio.