Download
1 / 113
1.13k likes | 1.19k Vues
This study provides an in-depth analysis of various supervised learning algorithms, comparing their performance and optimization across different datasets and problem types. It highlights the evolution of algorithms from linear regression to advanced techniques like neural networks and ensemble methods. The research delves into questions of algorithm superiority, suitability for different loss functions, and the impact of optimizing algorithms. Utilizing multiple performance metrics, including threshold, ordering, and probability-based, the study presents a comprehensive empirical comparison using 8 binary classification datasets. With a focus on normalized scores and learning curves, the research aims to offer insights into the strengths and limitations of different algorithms in binary classification tasks. Lastly, the study emphasizes the importance of predicting probabilities accurately as a key aspect of maximizing algorithm performance.

E N D
Empirical Comparison of Supervised Learning Algorithms Rich Caruana Cornell University
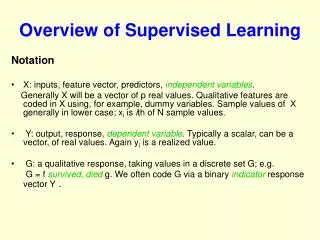
Supervised Learning 25 Years Ago • Linear/polynomial Regression • Logistic/Ridge regression • Linear perceptron • K-nearest neighbor • Decision trees
Supervised Learning Today • Linear/polynomial Regression • Logistic/Ridge regression • K-nearest neighbor • Linear perceptron • Decision trees • SVMs (Support Vector Machines) • Neural nets • Naïve Bayes • Bayesian Neural nets • Bayes Nets (Graphical Models) • Bagging (e.g. bagged decision trees) • Random Forests (forests of decision trees) • Boosting (e.g. boosted decision trees) • Boosted Stumps • ILP (Inductive Logic Programming) • Rule learners (C2, …) • Ripper • Gaussian Processes • …
Supervised Learning Today • Each algorithm has many variations and free parameters: • SVM: margin parameter, kernel, kernel parameters (gamma, …) • ANN: # hidden units, # hidden layers, learning rate, momentum • DT: splitting criterion, pruning options, smoothing options, … • KNN: K, distance metric, distance weighted averaging, … • Must optimize algorithms on each problem • failure to optimize can make superior algorithm inferior • optimization depends on performance criterion • e.g., for kNN: kaccuracy ≠ kROC ≠ kRMSE • optimization even depends on size of train set
Questions • Is one learning method “better” than the others? • Are some learning methods best for certain loss functions? • SVMs for classification? • Artificial neural nets for regression or predicting probabilities? • If no method(s) dominates, can we at least ignore some of them? • How can a method be good on loss X, but poor on loss Y? • How do we train models for a new loss Z? • How are different losses related to each other? • Are some losses “better” than others? • …
Supervised Learning Today • Linear/polynomial Regression • Logistic/Ridge regression • K-nearest neighbor • Linear perceptron • Decision trees • SVMs (Support Vector Machines) • Neural nets • Naïve Bayes • Bayesian Neural nets • Bayes Nets (Graphical Models) • Bagging (e.g. bagged decision trees) • Random Forests (forests of decision trees) • Boosting (e.g. boosted decision trees) • Boosted Stumps • ILP (Inductive Logic Programming) • Rule learners (C2, …) • Ripper • Gaussian Processes • …
Data Sets Used For Empirical Comparison • 8 binary classification data sets • Adult • Cover Type • Letter.p1 • Letter.p2 • Pneumonia • Hyper Spectral • SLAC Particle Physicsm • Mg • 4 k train sets • 1 k validation sets • Large final test sets (usually 20k) • Why this experimental design?
Binary Classification Performance Metrics • Threshold Metrics: • Accuracy • F-Score • Lift • Ordering/Ranking Metrics: • ROC Area • Average Precision • Precision/Recall Break-Even Point • Probability Metrics: • Root-Mean-Squared-Error • Cross-Entropy • Probability Calibration
Normalized Scores • Small Difficulty: • some metrics, 1.00 is best (e.g. ACC) • some metrics, 0.00 is best (e.g. RMS) • some metrics, baseline is 0.50 (e.g. AUC) • some problems/metrics, 0.60 is excellent performance • some problems/metrics, 0.99 is poor performance • Solution: Normalized Scores: • baseline performance => 0.00 • best observed performance => 1.00 (proxy for Bayes optimal) • puts all metrics on equal footing
Massive Empirical Comparison 10 learning methods X 100’s of parameter settings per method X 5 trials per = 10,000 models trained per problem X 8 Boolean classification test problems = 80,000 models X 10 performance metrics = 800,000 model performance evaluations
Limitations • Binary classification • not multi class • not regression • no structure on outputs • Can’t try every flavor of every algorithm • 20-200 dimensions • nothing really high-D • maybe this favors some algorithms over others • Only 8 data sets so far • 4k train, 1k validation • if learning curves cross, story would be different for large/small train sets • if algorithm does not need 1k validation, that 1k could be in train set • ???
Look at Predicting Probabilities First • Why? • don’t want to hit you with results for nine metrics all at once • if you can predict correct conditional probabilities, you’re done • all reasonable performance metrics are optimized by predicting true probabilities • results for probabilities are interesting by themselves
Results on Test Sets (Normalized Scores) • Best probabilities overall: • Neural Nets • Bagged Decision Trees • Random Forests • Not competitive: • Boosted decision trees and stumps (with exponential loss) • SVMs (with standard loss) • SVMs scaled to [0,1] via simple min/max scaling
Bagged Decision Trees • Draw 100 bootstrap samples of data • Train trees on each sample -> 100 trees • Average prediction of trees on out-of-bag samples … Average prediction (0.23 + 0.19 + 0.34 + 0.22 + 0.26 + … + 0.31) / # Trees = 0.24
Bagging Results 100 bagged trees single tree
Random Forests (Bagged Trees++) • Draw 1000+ bootstrap samples of data • Draw sample of the available attributes • Train trees on each sample/attribute set -> 1000+ trees • Average prediction of trees on out-of-bag samples … Average prediction (0.23 + 0.19 + 0.34 + 0.22 + 0.26 + … + 0.31) / # Trees = 0.24
Calibration • Good calibration: • If 100 days you predict 70% chance of rain [p(rain) = 0.70], if forecasts are well calibrated at p = 0.70, should rain ~70/100 days • If this is true for all values p, model is well calibrated everywhere
# # # # # # # # # # 0.0 0.1 0.2 0.3 0.4 0.5 0.6 0.7 0.8 0.9 1.0 Reliability Diagrams • Put cases with predicted values between 0 and 0.1 in first bin, … • For each bin, plot mean predicted value against true fraction of positives
Back to SVMs: Results on Test Sets • Best probabilities overall: • Neural Nets • Bagged Probabilistic Trees • Random Forests • Not competitive: • Boosted decision trees and stumps (with exponential loss) • SVMs (with standard loss) • SVMs scaled to [0,1] via simple min/max scaling
Platt Scaling by Fitting a Sigmoid • Scaling SVM [-∞,+∞] predictions to [0,1] is suboptimal • Platt’s Method: scale predictions by fitting with sigmoid
Results After Platt Scaling SVMs • Platt’s Method (Platt 1999) for obtaining posterior probabilities from SVMs by fitting a sigmoid • SVM probabilities as good as Neural Net probabilities after scaling with Platt’s Method • SVMs slightly better than Neural Nets on 2 of 3 metrics • Would other learning methods benefit from calibration with Platt’s Method?
Results After Platt Scaling SVMs • Boosted trees outperform everything else on 5 of 6 non-probability metrics. • But boosting predicts poor probabilities.
Good Model ≠ Good Probs • Model can be accurate, but be poorly calibrated • Only sensitive to side of threshold case falls on • Use threshold ≠ 0.5 if poorly calibrated • Model can have good ROC (Google-like ordering), but predict poor probabilities • ROC insensitive to scaling/stretching • Only ordering has to be correct, not probabilities
Boosting • Initialization: • Weight all training samples equally • Iteration Step: • Train model on (weighted) train set • Compute error of model on train set • Increase weights on train cases model gets wrong!!! • Typically requires 100’s to 1000’s of iterations • Return final model: • Carefully weighted prediction of each model
Why Boosting is Not Well Calibrated • Predicted values pushed away from 0 and 1 • Calibration becomes increasingly worse • Shape of the reliability plot becomes sigmoidal • Looks a lot like SVM predictions
Why Boosting is Not Calibrated • Boosting is a maximum-margin method (Schapire et al. 1998, Rosset et al. 2004) • Trades lower margin on easy cases for higher margin on harder cases • Boosting is an additive logistic regression model (Friedman, Hastie and Tibshirani 2000) • Tries to fit the logit of the true conditional probabilities • Boosting is an equalizer (Breiman 1998) (Friedman, Hastie, Tibshirani 2000) • Weighted proportion of times example is misclassified by base learners tends to be the same for all training cases
Platt Scaling • Before: • After:
Results After Platt Scaling All Models • Models that benefit from calibration: • SVMs • Boosted decision trees • Boosted stumps • Random forests • Naïve Bayes • Vanilla decision trees • Do not benefit from calibration: • Neural nets • Bagged trees • Logistic regression • MBL/KNN • Boosting full trees dominates
Results After Platt Scaling All Models • After Platt Scaling, boosted trees are best models overall across all metrics • Neural nets are best models overall if no calibration is applied post-training
Methods for Achieving Calibration • Optimize directly to appropriate criterion: • Boosting with log-loss (Collins, Schapire & Singer 2001) • SVM minimize negative log multinomial likelihood (Wahba 1999) • No need for post-training calibration with these approaches • Train models with “usual” criterion and post-calibrate: • Logistic Correction • Analytic method justified by the Friedman et al.’s analysis • Platt Scaling • Method used by Platt to calibrate SVMs by fitting a sigmoid • Is sigmoid right calibration function for most learning methods? • Isotonic Regression • Very general calibration method used by Zadrozny & Elkan (2001) • PAV (Pair Adjacent Violators) algorithm (Ayer et al. 1955) • Optimal for squared error • Efficient linear-time algorithm
Boosting with Log-Loss • Improves boosting calibration • Most effective with weak models such as 1-level stumps • Less effective with more complex models such as full decision trees (or even 2-level stumps) • Post-calibration with Platt’s Method far more effective, particularly with complex models such as full trees • Best probabilities come from full trees boosted with exponential loss then calibrated with Platt’s Method
Isotonic Regression • Basic assumption - there exists an isotonic (monotonically increasing) function m s.t.: • We want to find an isotonic function m s.t.:
Isotonic Regression • Before: • After:
Platt Scaling vs. Isotonic Regression • Platt Scaling: • Isotonic Regression:
Where Does That Leave Us? • Calibration via Platt Scaling or Isotonic Regression improves probs from max-margin methods such as Boosted Trees and SVMs • Boosted Trees + Calibration is best overall • Are we done? • No!
Best of the Best of the Best • Selecting best of all learning methods yields significantly better performance • No one model type can do it all (yet) • If you really need best performance, need to try multiple learning algorithms • If we look at individual problems, even more variation in what works best • Boosted stumps outperform boosted trees on 3 of 8 problems! • Logistic regression is best model on one problem!
“A necessary and sufficient condition for an ensemble of classifiers to be more accurate than any of its individual members is if the classifiers are accurate and diverse.” -- Tom Dietterich (2000)
Current Ensemble Methods • Bagging • Boosting • Error Correcting Output Codes (ECOC) … • Average of multiple models • Bayesian Model Averaging • Stacking … • Ensemble methods differ in: • how models are generated • how models are combined