Download
1 / 17
170 likes | 281 Vues
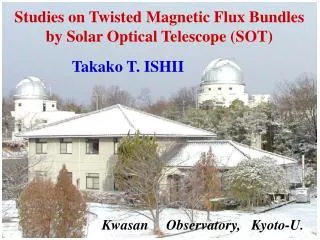
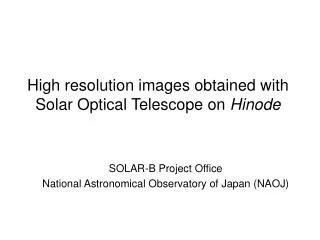
High resolution images obtained with Solar Optical Telescope on Hinode. SOLAR-B Project Office National Astronomical Observatory of Japan (NAOJ). Temperature stratification of solar atmosphere. G-band. Ca II H. Temperature minimum.

E N D
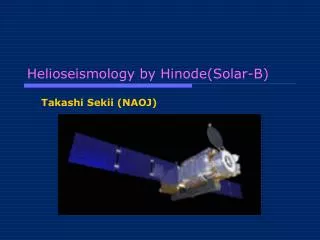
High resolution images obtained withSolar Optical Telescope on Hinode SOLAR-B Project Office National Astronomical Observatory of Japan (NAOJ)
Temperature stratification of solar atmosphere G-band Ca II H Temperature minimum Most of visible light is emitted from the photosphere, 500-km thin layer around the surface of the Sun.
The Solar Optical Telescope (SOT) on Hinode observes photosphere and chromosphere Corona Chromosphrer Temperature minimum Photosphere Magnetic field
Fine structures on the solar surface seen by the Solar Optical Telescope (SOT)
“Microscopic” observation by SOT 50000km (size of Earth) 430nm wavelength band (G-band) Solar Optical Telescope (SOT) on Hinode is the largest solar telescope flown in space, which provides the best spatial resolution. Its “microscopic” observation allows to observe fine structures in a Sun spot.
Close-up of granules 4000km 16000km 0.2 arcsec Granules and bright points corresponding to tiny magnetic features are clearly seen in the movie. Obtained data proves that SOT achieves the diffraction limit resolution of 50cm-aperture telescope, 2 arcsec in the wavelength of 430 nm.
Long-lasting stability SOT/Hinode Ground-based telescope Ground-based observation is disturbed by turbulence of Earth’s atmosphere. Good seeing condition does not last for a long time on the ground. On the other hand, SOT/Hinode realizes seeing-free observation 24 hours a day, which allows to trace dynamic behavior of the Sun.
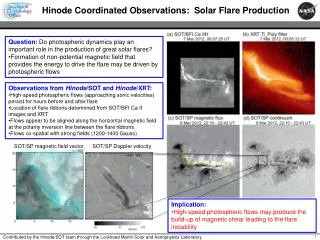
Implication of chromospheric heating G-band (Photosphere) Ca II H (Chromosphere) SOT/Hinode can simultaneously observe photosphere and chromosphere. G-band bright points indicate strong magnetic fluxs. Bright structures in Ca II H implies heating in the chromosphere. These precious data set provide a clue to the chromospheric heating.
50000km G-band (430nm) SOT/Hinode can measure magnetic field photosphere and observe the chromosphere above by selecting filters. This function allows us study dynamic phenomena such as the heating around Sun spot, flares, and jets.
50000km Longitudinalmagnetic field (Fe I 630nm) White and black of the magnetogram shows N and S polarities, respectively. Strength of magnetic field reaches 3000 Gauss in the Sun spot. Localized magnetic fluxes up to 1000 Gauss are observed outside the Sun spot.
50000km Ca II H (397nm) Spectral line of Ca II H mainly represents the chromosphere above the photoshere. Brightness indicates the strength of heating in the chromosphere, which coincide with magnetic field concentration on the photosphere.
Decaying Sun spot 半暗部の絵 Longitudinal magnetic field Ca II H Fragment of magnetic flux and bright points in Ca II H are flowing away from the Sun spot. Accompanying the movement, number of small brightening and flare are observed. This data set successfully tracked the process of magnetic energy build-up and its release.
Dynamic eruption above Sun spot 82000km This movie in Ca II H shows an active region near the limb of the Sun. It highlights brightenings and dynamic eruption around the Sun spot. Thanks to its low stray-light and distortion-free observation, SOT/Hinode has captured this dynamic phenomena for the first time.
1) Granule and small magnetic feature Visible cellular pattern of the photosphere is caused by convection below the photosphere. Hot upflow and cool downflow are seen bright and dark, respectively. Magnetic fluxes are swept by convection flow and concentrated in the converging region. Their typical size is 0.2 arcsec, or 140km on the Sun. Tiny magnetic flux upflow downflow downflow
2) Structure of Sun spot A Sun spot consists of central dark umbra and surrounding penumbra. In the umbra, strong magnetic flux prevents heat flux fro m deeper layer, which causes decreased temperature hence dark umbra. More inclined fields exists in the penumbra, which are observed as threads of magnetic field. Magnetic Field Umbra Penumbra