Download
1 / 2
20 likes | 249 Vues
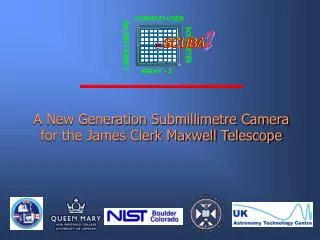
HIGH-RESOLUTION MILLIMETRE-WAVE HOLOGRAPHY ON THE JAMES CLERK MAXWELL TELESCOPE. REQUIREMENTS High precision surface measurement – goal is 5 microns Fast mapping: 20 minutes for map with 15cm resolution High-resolution mode: e.g. 8cm, to see defects in panels

E N D
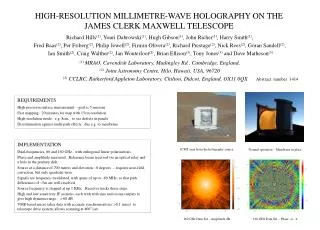
HIGH-RESOLUTION MILLIMETRE-WAVE HOLOGRAPHY ON THE JAMES CLERK MAXWELL TELESCOPE REQUIREMENTS High precision surface measurement – goal is 5 microns Fast mapping: 20 minutes for map with 15cm resolution High-resolution mode: e.g. 8cm, to see defects in panels Discrimination against multi-path effects, due e.g. to membrane. Richard Hills(1), Youri Dabrowski(1), Hugh Gibson(1), John Richer(1), Harry Smith(1), Fred Baas(2), Per Friberg(2), Philip Jewell(2), Firmin Olivera(2), Richard Prestage(2), Nick Rees(2), Göran Sandell(2), Ian Smith(2), Craig Walther(2), Jan Wouterloot(2), Brian Ellison(3), Tony Jones(3) and Dave Matheson(3) (1) MRAO, Cavendish Laboratory, Madingley Rd., Cambridge, England, (2) Joint Astronomy Centre, Hilo, Hawaii, USA, 96720 (3) CCLRC, Rutherford Appleton Laboratory, Chilton, Didcot, England, OX11 0QXAbstract number 1414 IMPLEMENTATION Dual-frequencies, 80 and 160 GHz, with orthogonal linear polarizations. Phase and amplitude measured. Reference beam received via an optical relay and a hole in the primary dish. Source at a distance of 700 metres and elevation ~8 degrees – requires near-field correction, but only quadratic term. Signals are frequency-modulated, with spans of up to ~60 MHz, so that path differences of ~5m are well resolved. Source frequency is stepped at up 1 KHz. Receiver tracks these steps. High and low sensitivity IF sections, each with with sine and cosine outputs to give high dynamic range: > 60 dB. VME-based micro takes data with accurate synchronisation ( >0.1 msec) to telescope drive system, allows scanning at 400”/sec. JCMT seen from the holography source Normal operation – Membrane in place 160 GHz Data Set – Phase +/– π 160 GHz Data Set – Amplitude dB
DATA ANALYSIS SOFTWARE Written in the Tcl scripting language, built on an extensive set of C++ routines. Data samples are first corrected for any offsets, non-orthogonality of the real and imaginary outputs and for phase and amplitude drifts. Low- and high-gain values of the signals are combined, phase corrections for the geometrical paths of the reference channel applied and the data are then interpolated onto a regular grid. Fourier transforms are taken, including near-field terms, to produce a set of maps: one for each of the frequencies in the scan pattern. The phase plot shows panels that are displaced very clearly. The amplitude plot shows the effects of the illumination by the feed, the shadowing caused by the legs which support the secondary mirror, and the diffraction rings due to the edge of the secondary. Differences between the maps taken at different frequencies show the effects of multi-path propagation. These are removed by taking a suitable average over frequency. Finally the phase pattern is corrected for the secondary diffraction effects (calculated separately) to produce a final map of the surface errors. Phase in aperture (radians) Amplitude in aperture (linear) RESULTS System now produces maps with a reasonable level of reliability. Mapping speed is not yet up to goals. Hard to make maps with bi-directional scanning. Lots of structure seen on frequency-difference maps. More work needed to explain it all and find best strategy for removing it. Accuracy is not yet fully established. Sensitivity is sufficient, but final accuracy will be limited by our understanding of systematic errors and, for much of the time, the stability of the atmosphere. Map of differences between frequencies Phase versus frequency at points on map ACKNOWLEDGEMENT The help and advice of all those who have played a part in the development of this system is much appreciated. The JCMT is operated by the Joint Astronomy Centre on behalf of the UK Particle Physics and Astronomy Research Council, the Netherlands Organization for Scientific Research and The Research Council of Canada. Final map of surface deviations in microns, with panels outlined