
Concentration
E N D
Presentation Transcript
An experience on modelling-based assessment of the air quality within the Air Quality Directive framework Ana Isabel Miranda, Isabel Ribeiro, Patrícia Fernandes, Alexandra Monteiro, Cristina Monteiro, Carlos Borrego
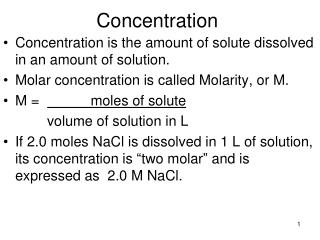
2008 Air Quality Directive| air quality assessment Assessment strategy depends on upper and lower assessment thresholds Those fixed measurements may be supplemented by modelling techniques and/or indicative measurements to provide adequate information on the spatial distribution of the ambient air quality. Fixed measurements shall be used Upper assessment threshold Combination of fixed measurements and modelling techniques and or indicative measurements may be used Concentration Lower assessment threshold Modelling techniques or objective-estimation shall be sufficient SO2, NO2, NOx, PM10, PM2,5, Pb, C6H6, CO
Assessment for 2010 and 2011 Upper and lowerthresholdsexceedances for 2006-2010 (5 yearsperiod). Exceedances of upper and lower assessment thresholds shall be determined on the basis of concentration during the previous 5 years where sufficient data are available. An assessment threshold shall be deemed to have been exceeded if it has beed exceed during at least 3 separate years out of those previous five years.
1.Model application to Portugal (5 km x 5 km), 2010 and 2011 2.Bias correction based on the multiplicative ratio adjustment technique 3.Evaluation (using the DELTA tool when possible) The approach Monitoring Modelling NO2, O3, PM10, PM2.5, SO2, CO, C6H6. 1.Monitoring stations selection and data treatment, for the period 2006-2010 2.Comparison with the upper and lower thresholds, for every pollutant 3. 2010 data treatment for the model evaluation AQ assessment based on a combination of Modelling and Measuring values
MM5-EURAD Emissions Meteorologicalconditions
Simulation domains 5x5 km2 25x25 km2 125x125 km2
Emissions EMEP 2008 for the largerdomains Portuguese inventory 2008 for the portuguese domain Industrial processes Transports
Bias-correction techniques We started to compare… SUBST an additive correctionof the mean bias RAT amultiplicative ratiocorrection
(Borrego et al., 2011, Atmospheric Environment) Bias-correction techniquesRAT & SUBST PM10 O3 • after BIAS correction, model results have a decrease > 70% on the average systematic error • the multiplicative ratio: better correction technique • synoptic conditions are characterized by a 3-4 day period.
Validation SO2 Hourly values – Calendário 2010 measured modelled RDE = 15%; R = 0.63; bias = -1.01 µg.m-3; MSE = 4.31 µg.m-3
SO2 4th maximum of the daily averages (protection of human health) Upper Lower LV Zones and agglomerations Threshold values were not exceeded
SO2 4th maximum of the daily averages (protection of human health) < LAT LAT-UAT > UAT 2010 It was not possible to have the needed data everywhere 2011
SO2 Annual average winter period (ecosystem protection) < LAT LAT-UAT >UAT 2011 2010
SO2 Annual average winter period (ecosystems protection) Modellingresults CORINE Land Cover 2006 GIS
SO2 25th maximum hourly value LV 2011 2010
Validation NO2 Hourly data
Validation NO2 Hourly data
NO2 Annual mean Upper Lower LV Zones and agglomerations
NO2 Annual mean LV < LAT LAT-UAT > UAT 2010 2011
NO2 Annual mean Modellingresults Population data atsub-municipalitylevel Nationalroads network GIS
NO2 19th maximum of the hourly averages (protection of human health) Upper Lower LV Zones and agglomerations
NO2 19th maximum of the hourly averages LV < LAT LAT-UAT > UAT 2011 2010
NO2 19th maximum of the hourly averages
NO2 Number of hoursexceeding the LV 2010 2011
Validation PM10 Daily average
Validation PM10 Daily average
PM10 Annual average LV < LAT LAT-UAT > UAT 2010 2011
PM10 Daily average LV < LAT LAT-UAT > UAT 2011 2010
Final comments Thisworkwasrequested by the Portuguese Agency for the Environment. Itwaspresented to the nationalagency and to the different regional entities in charge of the airqualityassessment in Portugal. Severalcomments and feedbacks werereceived. Theywereveryinterested and willing to do a cost-benefitanalysis of usingmodellingtools and reducingmonitoring stations instead of keeping the maintenancecoststhey’refacingnowadays. We’redoing 2012 and we’regoing to increasespatialresolution. Notwithstandingthismodellingwork no modelling-basedreport to the Comissionwasdelivered.
But … • There is a strong difficulty to trust models and people is afraid of using them, because: • they were always working with AQ monitoring networks and that’s what they know • they think models are a kind of “monster” and they do not provide a really added value February 2009
Attitude towards models changed and people are much more receptive to their use for air quality assessment. Thanks to FAIRMODE!!!!
Thankyouverymuch!!! www.ua.pt/gemac miranda@ua.pt