Download
1 / 35
350 likes | 491 Vues
This work explores non-stationary population genetic models, emphasizing the complexities of inferring natural selection from genetic data. It addresses statistical tests of the neutral theory, methods for detecting selective sweeps, and parameter estimation for selection. The impact of demographic history on genetic data is examined, demonstrating how population structure and growth can obscure signals of selection. Notably, it discusses the McDonald-Kreitman test, which evaluates the distinction between adaptive evolution and demographic effects, enhancing our understanding of evolution in natural populations.

E N D
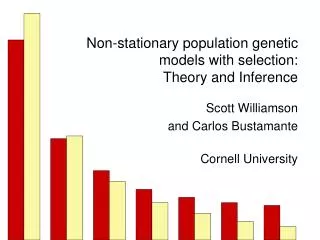
Non-stationary population genetic models with selection:Theory and Inference Scott Williamson and Carlos Bustamante Cornell University
Inferring natural selection from samples • Statistical tests of the neutral theory (lots) • Methods for detecting selective sweeps (lots) • Parametric inference: estimating selection parameters, etc. • Quantification of selective constraint, deleterious mutation
The demography problem • Many existing methods assume random mating, constant population size • These assumptions don’t apply in most natural populations • The effect of demography can mimic the effect of natural selection
Natural selection and population growth • Inferring selection from the frequency spectrum while correcting for demography • The McDonald-Kreitman test: does recent population growth cause you to misidentify negative selection as adaptive evolution?
7019 4424 4961 5286 1972 2188 3529 163 975 A G G C T T A A A 1 A T G C T C G A A 2 G T G T T C A C G 3 A G G C T C A A G 4 A G A C C C G A A 5 1 2 1 1 1 4 2 1 3 The frequency spectrum: an example The frequency spectrum Site Sequence Count Frequency class: Frequency class Ancestral Derived
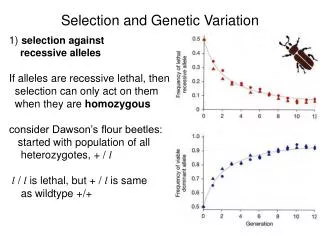
Natural selection and the frequency spectrum Equilibrium neutral and positively selected frequency spectra Neutral 2Ns=2 Count Frequency class
Natural selection and the frequency spectrum Equilibrium neutral and negatively selected frequency spectra Neutral 2Ns=-2 Count Frequency class
Natural selection vs. demography Non-stationary neutral and equilibrium selected frequency spectra Population growth, neutral Equilibrium, 2Ns=-2 Count Frequency class
How do we distinguish selection from demography? • McDonald-Kreitman approach: • Use a priori information to classify changes as “neutral” (e.g. synonymous, non-coding) or “potentially selected” (e.g. non-synonymous) • Putatively neutral changes are treated as a standard for patterns of neutral evolution in a particular sample • Potentially selected sites are compared to the neutral standard Can we develop a neutral standard for the frequency spectrum?
Comparing frequency spectra for different classes of mutation Observed frequency spectra • This talk: • Likelihood ratio test of neutrality at potentially selected sites, using information from the neutral sites • Biologically meaningful measure of the difference between the two spectra Putatively neutral Potentially selected Count Frequency class
Comparing frequency spectra for different classes of mutation Observed frequency spectra A model-based approach: • Fit a neutral demographic model to estimate demographic parameters Putatively neutral Potentially selected Count • Given those parameter estimates, fit a selective demographic model to estimate selection parameters, test hypotheses Frequency class
Comparing frequency spectra for different classes of mutation Observed frequency spectra • Requirements: • Demographic model • Frequency spectrum predictions from the model under neutrality • Frequency spectrum predictions from the model subject to natural selection Putatively neutral Potentially selected Count Frequency class
Theory: population growth model 2-epoch model NC Population size NA =NA/NC time now Model parameters: ,
Theory: predicting the frequency spectrum Definitions: xi Number of sites in frequency class i f(q,t;) Distribution of allele frequency, q, at time t n Sample size Predictions:
Theory: the distribution of allele frequency Poisson Random Field approach (Sawyer and Hartl 1992): • Use single-locus diffusion theory to predict the distribution of allele-frequency • If sites are independent (i.e. in linkage equilibrium) and identically distributed, then the single-locus theory applies across sites To get f, we need to solve the diffusion equation:
Theory: time-dependent solution, neutral case The forward equation under neutrality: Kimura’s (1964) solution, given some initial allele frequency, p:
Theory: time-dependent solution, neutral case Applying Kimura’s solution to the 2-epoch model: ancestral mutations Kimura’s (1964) solution, given some initial allele frequency, p: Distribution of allele frequency:
Theory: time-dependent solution, neutral case Expected frequency spectrum after a change in population size (=0.01) 0.8 0.6 P(i,n;,0.01) 0.4 0.2 1 2 3 4 5 6 7 8 9 frequency class
Theory: time-dependent solution, neutral case Multinomial likelihood: Maximum likelihood estimates of and Likelihood ratio test of population growth
Comparing frequency spectra for different classes of mutation Observed frequency spectra • Requirements: • Demographic model • Frequency spectrum predictions from the model under neutrality • Frequency spectrum predictions from the model subject to natural selection Putatively neutral Potentially selected Count Frequency class
Theory: time-dependent solution, selected case The forward equation with selection: where =2NCs Initial condition:
Theory: time-dependent solution, selected case • Numerically solve the forward equation using the Crank-Nicolson finite differencing scheme • Use this approximation of f to evaluate the likelihood function: • Fix and to their MLEs from the neutral data • Optimize the likelihood for . Likelihood ratio test of neutrality:
Theory: time-dependent solution, selected case How can we be sure that the numerical solution actually works? • Von Neumann stability analysis: solution is unconditionally stable • Numerical solution converges to the stationary distribution after ~4NC generations • Comparison with time-dependent neutral predictions: Kimura, Crank, and Nicolson all agree with each other
Human Polymorphism Data • From Stephens et al. (2001) • 80 individuals, geographically diverse ancestry • 313 genes, 720 kb sequenced • ~3000 SNPs (72% non-coding, 13% synonymous, 15% non-synonymous)
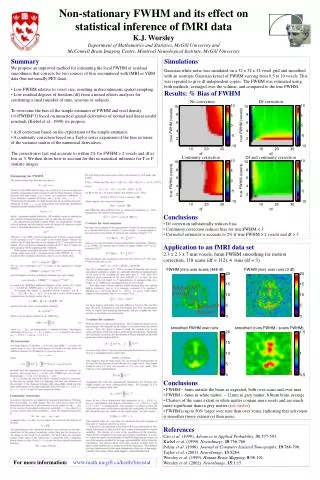
Results for non-synonymous changes, categorized by Grantham’s distance
Ongoing work and future directions • Simulate, simulate, simulate • How robust is the method to different types of demographic forces? • How does linkage among some sites affect the analysis? • How does estimation error affect the LRTs? • Numerical solution for different demographic scenarios (e.g. bottleneck, population structure) • Variable selective effects among new mutations
The McDonald-Kreitman test Sn Number of non-synonymous segregating sites Dn Number of non-synonymous fixed differences Ss Number of synonymous segregating sites Ds Number of synonymous fixed differences Adaptive evolution Negative selection Extensions: Sawyer and Hartl (1992), Rand and Kann (1996), Smith and Eyre-Walker (2002), Bustamante et al. (2002), others
Demography and the McDonald-Kreitman test • Robust to different demographic scenarios because it implicitly conditions on the underlying genealogy (see Nielsen 2001) • However, under some demographic scenarios it’s possible to misidentify the type of selection • Weak negative selection with population growth • When the population size is small, non-synonymous deleterious mutations might be fixed by drift • Once the population size becomes large, the level of non-synonymous polymorphism would be reduced (relative to the level of synonymous polymorphism)
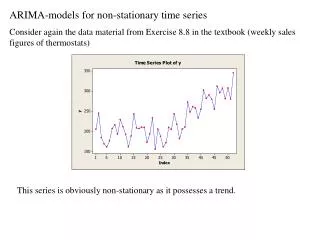
Demography and the McDonald-Kreitman test • Over what range of parameter values might you misidentify negative selection as adaptive evolution? • How large is the effect? Eyre-Walker (2002): • Addressed these questions, finding that recent population growth or bottlenecks can cause you to misidentify negative selection • Assumed that levels of polymorphism and fixation rates changed instantaneously with population size
Demography and the McDonald-Kreitman test where tdiv is the divergence time, measured in 2NC generations
Demography and the McDonald-Kreitman test =0.1, tdiv=10 10 10 =0.1, tdiv=4 1 1 0.1 1 0.1 1 0.01 0.01 Expected Neutrality Index (NI) =1, tdiv=4 =1, tdiv=10 10 10 1 1 0.1 1 0.1 1 0.01 0.01 (=NA/NC)
Demography and the McDonald-Kreitman test: Preliminary results • It is possible to misidentify negative selection for some parameter combinations • But…the parameter range over which this is true is probably smaller than previously thought, as is the magnitude of the effect
Summary • Model-based approach to correcting for demography while inferring selection • Evidence for very recent population growth in humans • Reasonable estimates of selection parameters for classes of non-synonymous changes • McDonald-Kreitman test: negative selection + population growth problem not as severe as previously thought • Numerical methods for solving the diffusion are fast, accurate, and fun!
Collaborator:Carlos Bustamante Acknowledgements Data:Genaissance Pharmaceuticals Helpful discussions:Bret Payseur, Rasmus Nielsen, Matt Dimmic, Jim Crow, Hiroshi Akashi, Graham Coop