Download
1 / 1
10 likes | 189 Vues
Non-stationary FWHM and its effect on statistical inference of fMRI data K.J. Worsley Department of Mathematics and Statistics, McGill University and McConnell Brain Imaging Centre, Montreal Neurological Institute, McGill University. Summary

E N D
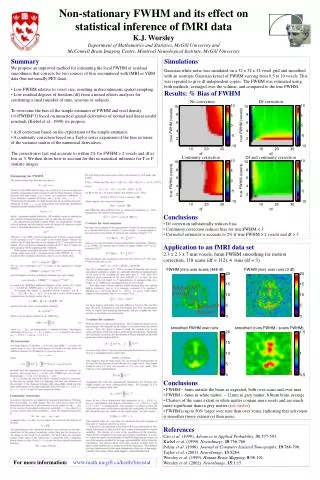
Non-stationary FWHM and its effect on statistical inference of fMRI data K.J. WorsleyDepartment of Mathematics and Statistics, McGill University and McConnell Brain Imaging Centre, Montreal Neurological Institute, McGill University • Summary • We propose an improved method for estimating the local FWHM or residual smoothness that corrects for two sources of bias encountered with fMRI or VBM data (but not usually PET data): • Low FWHM relative to voxel size, resulting in discontinuous spatial sampling. • Low residual degrees of freedom (df) from a mixed effects analyses for combining a small number of runs, sessions or subjects. • To overcome the bias of the simple estimator of FWHM and resel density (=1/FWHM^3) based on numerical spatial derivatives of normalized linear model residuals (Kiebel et al., 1999) we propose: • A df correction based on the expectation of the simple estimator. • A continuity correction based on a Taylor series expansion of the bias in terms of the variance matrix of the numerical derivatives. • The correction is fast and accurate to within 2% for FWHM > 2 voxels and df as low as 3. We then show how to account for this in statistical inference for T or F statistic images. Simulations Gaussian white noise was simulated on a 32 x 32 x 32 voxel grid and smoothed with an isotropic Gaussian kernel of FWHM varying from 0.5 to 10 voxels. This was repeated to give df independent copies. The FWHM was estimated using both methods, averaged over the volume, and compared to the true FWHM. Results: % Bias of FWHM No correction Df correction Continuity correction Df and continuity correction • Conclusions • Df correction substantially reduces bias. • Continuity correction reduces bias for true FWHM < 3 • Corrected estimator is accurate to 2% if true FWHM > 2 voxels and df > 3 Application to an fMRI data set 2.3 x 2.3 x 7 mm voxels, 6mm FWHM smoothing for motion correction, 118 scans (df = 112), 4 runs (df = 3). Resels=1.90 P=0.007 Resels=0.57 P=0.387 • Conclusions • FWHM ~ 6mm outside the brain as expected, both over scans and over runs • FWHM ~ 6mm in white matter, ~ 12mm in grey matter, 8.8mm brain average • Clusters of the same extent in white matter contain more resels and are much more significant than in grey matter (red circles) • FWHM is up to 50% larger over runs than over scans, indicating that activation is smoother (more extensive) than noise. References Cao et al. (1999). Advances in Applied Probability, 31:577-593. Kiebel et al. (1999). NeuroImage, 10:756-766. Poline et al. (1996). Journal of Computer Assisted Tomography, 19:788-796. Taylor et al. (2001). NeuroImage, 13:S264. Worsley et al. (1999). Human Brain Mapping, 8:98-101. Worsley et al. (2002). NeuroImage, 15:1:15. For more information:www.math.mcgill.ca/keith/fmristat