Download
1 / 41
430 likes | 724 Vues
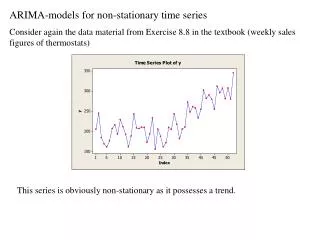
ARIMA-models for non-stationary time series Consider again the data material from Exercise 8.8 in the textbook (weekly sales figures of thermostats). This series is obviously non-stationary as it possesses a trend. SAC and SPAC.

E N D
ARIMA-models for non-stationary time series Consider again the data material from Exercise 8.8 in the textbook (weekly sales figures of thermostats) This series is obviously non-stationary as it possesses a trend.
SAC and SPAC The first impression is that this points towards an AR(2)-model. What will happen if we try such a model?
We may ask for forecast for weeks (53, 54, 55,) 56 and 57 like was the task in exercise 8.8. Note that we have to manually enter the columns where we wish the forecasts and the prediction limits to be stored (columns are not generated automatically like for other modules).
ARIMA Model: y Estimates at each iteration Iteration SSE Parameters 0 85100.7 0.100 0.100 182.480 1 61945.7 0.250 0.187 129.078 2 48376.0 0.400 0.272 75.777 3 44295.6 0.534 0.346 28.278 4 44267.8 0.542 0.348 26.509 5 44267.5 0.542 0.347 26.800 6 44267.5 0.542 0.347 26.837 Relative change in each estimate less than 0.0010 * WARNING * Back forecasts not dying out rapidly
Back forecasts (after differencing) Lag -97 - -92 241.106 241.105 241.105 241.104 241.103 241.103 Lag -91 - -86 241.102 241.101 241.100 241.099 241.098 241.096 Lag -85 - -80 241.095 241.094 241.092 241.090 241.088 241.086 Lag -79 - -74 241.084 241.081 241.079 241.076 241.073 241.069 Lag -73 - -68 241.065 241.061 241.057 241.052 241.047 241.041 Lag -67 - -62 241.035 241.028 241.020 241.012 241.004 240.994 Lag -61 - -56 240.984 240.972 240.960 240.947 240.932 240.916 Lag -55 - -50 240.899 240.880 240.860 240.838 240.814 240.788 Lag -49 - -44 240.759 240.728 240.694 240.658 240.618 240.574 Lag -43 - -38 240.527 240.475 240.419 240.359 240.292 240.220 Lag -37 - -32 240.142 240.057 239.964 239.863 239.753 239.633 Lag -31 - -26 239.503 239.362 239.208 239.041 238.859 238.660 Lag -25 - -20 238.445 238.210 237.955 237.678 237.376 237.047 Lag -19 - -14 236.690 236.301 235.878 235.418 234.917 234.373 Lag -13 - -8 233.780 233.136 232.434 231.671 230.841 229.940 Lag -7 - -2 228.951 227.899 226.692 225.545 223.855 223.190 Lag -1 - 0 219.355 223.431
Back forecast residuals Lag -97 - -92 -0.001 -0.001 -0.002 -0.002 -0.002 -0.002 Lag -91 - -86 -0.002 -0.002 -0.003 -0.003 -0.003 -0.003 Lag -85 - -80 -0.004 -0.004 -0.004 -0.005 -0.005 -0.005 Lag -79 - -74 -0.006 -0.006 -0.007 -0.008 -0.008 -0.009 Lag -73 - -68 -0.010 -0.011 -0.012 -0.013 -0.014 -0.015 Lag -67 - -62 -0.016 -0.018 -0.019 -0.021 -0.023 -0.025 Lag -61 - -56 -0.027 -0.029 -0.032 -0.035 -0.038 -0.041 Lag -55 - -50 -0.044 -0.048 -0.053 -0.057 -0.062 -0.068 Lag -49 - -44 -0.074 -0.080 -0.087 -0.095 -0.103 -0.112 Lag -43 - -38 -0.122 -0.133 -0.145 -0.157 -0.171 -0.186 Lag -37 - -32 -0.203 -0.220 -0.240 -0.261 -0.284 -0.309 Lag -31 - -26 -0.336 -0.366 -0.398 -0.433 -0.471 -0.512 Lag -25 - -20 -0.557 -0.606 -0.659 -0.717 -0.780 -0.849 Lag -19 - -14 -0.924 -1.005 -1.093 -1.189 -1.294 -1.408 Lag -13 - -8 -1.532 -1.666 -1.813 -1.972 -2.146 -2.332 Lag -7 - -2 -2.545 -2.748 -3.043 -3.170 -3.820 -3.172 Lag -1 - 0 -6.060 0.325
Final Estimates of Parameters Type Coef SE Coef T P AR 1 0.5420 0.1437 3.77 0.000 AR 2 0.3467 0.1460 2.38 0.022 Constant 26.837 4.485 5.98 0.000 Mean 241.11 40.30 Number of observations: 52 Residuals: SS = 44137.6 (backforecasts excluded) MS = 900.8 DF = 49 Modified Box-Pierce (Ljung-Box) Chi-Square statistic Lag 12 24 36 48 Chi-Square 8.6 19.8 27.1 34.5 DF 9 21 33 45 P-Value 0.473 0.532 0.753 0.873 Forecasts from period 52 95% Limits Period Forecast Lower Upper Actual 53 310.899 252.062 369.736 54 314.956 248.033 381.878 55 305.330 228.528 382.132 56 301.520 218.517 384.523 57 296.117 207.816 384.418
Residuals after fitting looks nice, Ljung-Box’ statistics are in order but.. the forecasts do not seem to be consistent with the development of the sales figures and… we have indications of problems in the fitting (back-forecasts are not dying out rapidly which they should) We do not go any deeper into the subject of back-forecasting, but a signal from the software should be taken seriously. As we have clearly seen a trend, we can force a model which takes this into account. Calculate first-order differences
One significant spike in SAC, one significant spike in SPAC. Both are negative consistence! Most presumable models for the differenced data: AR(1) , MA(1) or ARMA(1,1) When fitting such models to differenced data, constant term should be excluded as the differences are expected to vary around 0.
AR(1): MA(1): ARMA(1,1): Type Coef SE Coef T P AR 1 -0.4042 0.1356 -2.98 0.004 MS = 905.0 DF = 50 Modified Box-Pierce (Ljung-Box) Chi-Square statistic Lag 12 24 36 48 Chi-Square 12.6 23.8 30.3 38.1 P-Value 0.318 0.413 0.695 0.820 Type Coef SE Coef T P MA 1 0.6331 0.1133 5.59 0.000 MS = 813.1 DF = 50 Modified Box-Pierce (Ljung-Box) Chi-Square statistic Lag 12 24 36 48 Chi-Square 10.7 20.4 28.2 36.2 P-Value 0.471 0.617 0.785 0.873 Seems best! Type Coef SE Coef T P AR 1 0.0948 0.2376 0.40 0.692 MA 1 0.6751 0.1763 3.83 0.000 MS = 825.7 DF = 49 Modified Box-Pierce (Ljung-Box) Chi-Square statistic Lag 12 24 36 48 Chi-Square 9.1 19.1 27.5 35.6 P-Value 0.525 0.641 0.775 0.866
Fitting the model directly on the original observations. This time series seems to after first-order differencing apply to a MA(1)-model. The time-series is then said to apply to an ARIMA(0,1,1)-model For non-seasonal time series the notation is ARIMA(p,d,q) Order (q ) of the MA-part in the differenced series Order (p )of the AR-part in the differenced series Order (d ) of the differencing
ARIMA(0,1,1) Relevant again, as the original time series may have an “intercept”
ARIMA Model: y Estimates at each iteration Iteration SSE Parameters 0 49361.5 0.100 2.825 1 45310.4 0.250 2.496 2 42249.3 0.400 2.245 3 39884.7 0.550 2.106 4 38533.0 0.687 2.124 5 38448.9 0.717 2.220 6 38447.7 0.719 2.248 7 38447.7 0.720 2.251 8 38447.7 0.720 2.252 Relative change in each estimate less than 0.0010 No longer any problems with back-forecasts!
Final Estimates of Parameters Type Coef SE Coef T P MA 1 0.7198 0.1010 7.13 0.000 Constant 2.252 1.127 2.00 0.051 Differencing: 1 regular difference Number of observations: Original series 52, after differencing 51 Residuals: SS = 38356.2 (backforecasts excluded) MS = 782.8 DF = 49 Note that information is given about the order of the differencing. MS is the smallest so far (due to the inclusion of the constant term)
Modified Box-Pierce (Ljung-Box) Chi-Square statistic Lag 12 24 36 48 Chi-Square 10.9 21.1 29.5 37.5 DF 10 22 34 46 P-Value 0.366 0.513 0.689 0.809 Forecasts from period 52 95% Limits Period Forecast Lower Upper Actual 53 313.544 258.696 368.392 54 315.796 258.836 372.756 55 318.048 259.052 377.045 56 320.300 259.335 381.265 57 322.552 259.681 385.424 L-B’s are in order
Forecasts are now more consistent with the development of the sales figures. SAC and SPAC of residuals are still satisfactory.
Sometimes the non-stationary can be identified directly from the SAC and SPAC plots. Note! Monthly data, but of the kind that usually do not contain seasonal variation within a year. SAC and SPAC usually indicate an AR(1)-model with slowly decreasing autocorrelations and with first value very close to 1
Seasonal ARIMA-models (Weak) stationarity is often (wrongly) connected with a series that seems to vary non-systematically around a constant mean Stationary? Non-Stationary?
Are the spikes outside the red border evidence of non-stationarity?
We can always try to differentiate the series: zt=yt – yt-1 No improvement!!
Autocorrelation Function (with 5% significance limits for the autocorrelations) 1.0 0.8 0.6 n 0.4 o i t a 0.2 l e r r 0.0 o c o -0.2 t u A -0.4 -0.6 -0.8 -1.0 1 5 10 15 20 25 30 35 40 45 50 55 60 Lag Note that the spikes (besides the first ones) lie around the lags 12, 24, 36, 48 and 60. Could it have something to do with seasonal variation?
Seasonal AR-models: where L is the number of seasons (during a year) Such a model takes care of both short-memory and long-memory relations within the series yt . More correct terms are nonseasonal and seasonal variation. The series can still be stationary. We differ between stationarity at the nonseasonal level and stationarity at the seasonal level. We do not consider the model as an AR(P L)-model!
In a stationary Seasonal AR-process (SAR(p,P) ) • ACF spikes at nonseasonal level (scale), i.e. between 1 and L die down in an exponential fashion (possibly oscillating). • PACF spikes at non-seasonal level (scale) cuts off after lag p. • ACF spikes at seasonal level (scale), i.e. at lags L, 2L, 3L, 4L, … die down in an exponential fashion (possibly oscillating). • PACF spikes at seasonal level (scale) cuts off after lag PL. • Moderate ACF and PACF spikes usually exist around L, 2L, 3L, 4L, …
A more correct formulation of the model is where Byt = yt – 1 , B2yt = yt – 2 , …, BLyt = yt – L , … (the backshift operator) In the special case of p=1 and P=1 we get i.e. we should model a dependency at lags 1, 12 and 13 to take into account the ”double” autoregressive structure
Seasonal MA-models (SMA(q,Q)) • ACF spikes at nonseasonal level cuts off after lag q. • PACF spikes at nonseasonal level, i.e. between 1 and L die down in an exponential fashion (possibly oscillating). • ACF spikes at seasonal level cuts off after lag QL. • PACF spikes at seasonal level, i.e. at lags L, 2L, 3L, 4L, … die down in an exponential fashion (possibly oscillating). • Moderate ACF and PACF spikes usually exist around L, 2L, 3L, 4L, … • The model can be written with backshift operator B analogously with SAR-models.
Seasonal ARMA-models (SARMA(p,P,q,Q)) Expression becomes more condensed with backshift operator: Note that the expressions within parentheses are polynomials either in B or in BL. A more common formulation is therefore to denote these polynomials
SARMA-models have similar patterns at non-seasonal scale and at seasonal scale • as those of ARMA-models, i.e. a mix of sinusoidal and exponentially decreasing • spikes. • Non-stationary series? • yt~ ARIMA(p,d,q,P,D,Q)L • means taking dth order differences at nonseasonal level zt = (1 – B)dyt • (so-called regular differences) and Dth order differences at seasonal level wt = (1 – BL)Dzt • wt = (1 – BL)D (1 – B)dyt Then, model the differenced series with SARMA(p,P,q,Q)
Have another look at the SAC and SPAC of the series with obvious seasonal variation: SAC spikes at exact seasonal lags die down SAC and SPAC spikes close to exact seasonal lags are pronounced SPAC spikes at exact seasonal lags guts off at lag 1 SAC nonseasonal spikes die down SPAC nonseasonal spikes might cut off at lag 1 ARIMA(1,0,0,1,0,0)12 ??
Minitab: StatTime Series…ARIMA… ARIMA( 1 , 0 , 0 , 1 , 0 , 0 ) 12
Final Estimates of Parameters Type Coef SE Coef T P AR 1 -0.3089 0.0554 -5.57 0.000 SAR 12 0.8475 0.0340 24.91 0.000 Constant 1.17077 0.05320 22.01 0.000 Mean 5.8672 0.2666 Number of observations: 300 Residuals: SS = 251.964 (backforecasts excluded) MS = 0.848 DF = 297 Modified Box-Pierce (Ljung-Box) Chi-Square statistic Lag 12 24 36 48 Chi-Square 20.8 51.3 62.6 81.2 DF 9 21 33 45 P-Value 0.014 0.000 0.001 0.001 OK! Not OK !
The time series in question has actually been generated with the model with ati.i.d N(0.1) This model is stationary, as conditions for stationarity in AR(1)-models are fulfilled at both nonseasonal and seasonal level. Type Coef SE Coef T P AR 1 -0.3089 0.0554 -5.57 0.000 SAR 12 0.8475 0.0340 24.91 0.000 Constant 1.17077 0.05320 22.01 0.000 Mean 5.8672 0.2666 Still there might be problems with the Ljung-Box statistics!
An example with real data: Monthly registered men at work (labour statistics) in pulp and paper related industry from January 1987 to March 2005 The series possesses a downward trend and seasonal pattern.
Obvious signs of non-stationarity. Try 1 regular difference: (1 – B)yt and additionally 1 seasonal difference (1 – B12)(1 – B)yt MTB > diff c5 c6 MTB > diff 12 c6 c7
AR(2) at nonseasonal level? MA(1) at seasonal level?
Final Estimates of Parameters Type Coef SE Coef T P AR 1 -0.8199 0.0505 -16.24 0.000 AR 2 -0.7120 0.0499 -14.28 0.000 SMA 12 0.6275 0.0558 11.24 0.000 Constant -0.0484 0.7754 -0.06 0.950 Differencing: 1 regular, 1 seasonal of order 12 Number of observations: Original series 219, after differencing 206 Residuals: SS = 176265 (backforecasts excluded) MS = 873 DF = 202 Modified Box-Pierce (Ljung-Box) Chi-Square statistic Lag 12 24 36 48 Chi-Square 20.0 32.0 52.6 73.4 DF 8 20 32 44 P-Value 0.010 0.044 0.012 0.004