
Uploaded by
joey
1 SLIDES
107 VUES
10LIKES
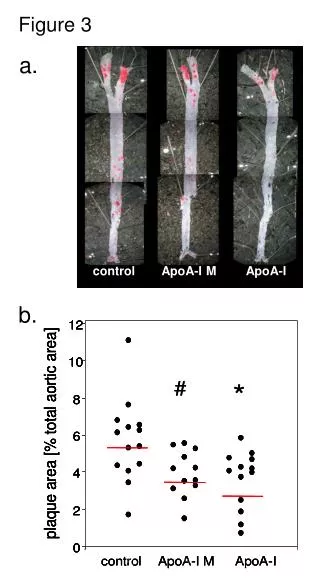
Understanding the Role of ApoA-I in Cholesterol Regulation
DESCRIPTION
Explore the significance of ApoA-I in cholesterol metabolism and its impact on cardiovascular health. This study delves into the mechanisms through which ApoA-I influences lipid transport and offers insights into potential therapeutic approaches.
Download
1 / 1
Download Presentation

Télécharger la présentation
Understanding the Role of ApoA-I in Cholesterol Regulation
An Image/Link below is provided (as is) to download presentation
Download Policy: Content on the Website is provided to you AS IS for your information and personal use and may not be sold / licensed / shared on other websites without getting consent from its author.
Content is provided to you AS IS for your information and personal use only.
Download presentation by click this link.
While downloading, if for some reason you are not able to download a presentation, the publisher may have deleted the file from their server.
During download, if you can't get a presentation, the file might be deleted by the publisher.
E N D


More Related
Audio
Live Player