Understanding Glycated HSA Levels in Diabetes through Comparative Blot Analysis
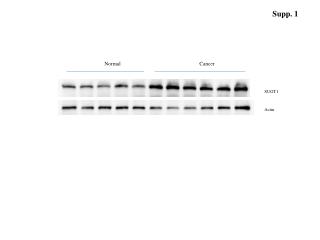
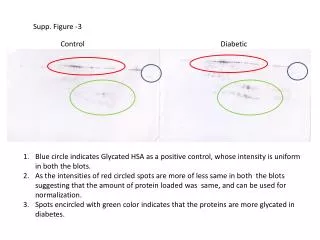
This figure illustrates the control of Glycated Human Serum Albumin (HSA) in a diabetic context. The blue circle indicates a uniform positive control, while the red circled spots demonstrate consistent protein loading across both blots, suggesting they can be effectively normalized. The green encircled spots indicate higher levels of glycation in diabetes. This visual representation highlights the differences in protein glycation, essential for understanding diabetes' impact on serum proteins and could serve as a basis for further research into diabetic complications.

Understanding Glycated HSA Levels in Diabetes through Comparative Blot Analysis
E N D
Presentation Transcript
Supp. Figure -3 Control Diabetic Blue circle indicates Glycated HSA as a positive control, whose intensity is uniform in both the blots. As the intensities of red circled spots are more of less same in both the blots suggesting that the amount of protein loaded was same, and can be used for normalization. Spots encircled with green color indicates that the proteins are more glycated in diabetes.