Download
1 / 30
300 likes | 645 Vues
Forecasting the Weather. Weather. Weather: The daily conditions of a particular area: temp, rain, pressure, wind, etc. Climate: the measure of weather over a very long period of time—at least 100 years Meteorology- the science of studying weather. 2. What is a weather forecast?.

E N D
Weather • Weather: The daily conditions of a particular area: temp, rain, pressure, wind, etc. • Climate: the measure of weather over a very long period of time—at least 100 years • Meteorology- the science of studying weather 2
What is a weather forecast? • Forecast: A prediction of weather over the next 5-10 days.
What is a meteorologist? • Meteorologist: A person who observes the atmosphere, collects data, and makes predictions—forecasts—based on the data. • Meteorologist = weather person • You know them as weathermen and weatherwomen.
What do meteorologists measure? • Air pressure • Humidity • Precipitation • Temperature • Wind speed • Wind direction
Weather balloonsPictures courtesy of http://www.srh.noaa.gov/epz/kids/balloon.shtml:
Weather Instruments Thermometer Doppler Radar Anemometer Barometer Weather Satellite Wind Sock 7
Weather Balloons • Weather balloons: Carry equipment as high as 30 km above the Earth’s surface • Measure temperature, air pressure, relative humidity, wind speed, & direction
Thermometer • Thermometer: Used to measure: • air temperature
Barometer • Barometer: Used to measure air pressure
Psychrometer An instrument used for measuring the water vapor content of the atmosphere; a type of hygrometer.
Anemometer • Used to measure wind speed
Wind Sock • Used to measure wind direction
Wind Vane/Weather Vane • Used to measure wind direction
Radar • Used to find location, movement, kind & amount of precipitation
Weather Satellite • Orbit the Earth & send information back to Earth; used to track storms, wind speed, humidity, & temperature @ different altitudes
Collecting & Analyzing Weather Data • 2 groups who gather information: • National Weather Service (NWS) • NOAA (National Oceanographic & Atmospheric Administration)
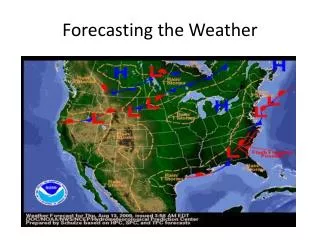
NWS • Produce maps based on information gathered from over 1,000 weather stations nationwide
Station Model • A small circle that shows the location of a weather station • Surrounding the small circle is a set of symbols & numbers that represent weather data
Weather Map Symbols High Pressure Clear Weather Cold Front Warm Front Low Pressure Cloudy Weather Occluded Front Isobars: Show equal Lines of Pressure. Stationary Front 23
Cold Front • Represented by triangles on a line
Warm Front • Represented by half-circles on a line:
High Pressure • Usually brings clear, sunny weather
Low Pressure • Bring rainy weather
Isobars • Lines that connect points of equal pressure on a weather map
ISOBARS- Certain weather maps allow us to view High and Low pressure systems that control the weather. An isobar is a line connecting locations of equal barometric pressure. Isobar maps show where pressures are relatively high and low, and show us where pressure changes are gradual or dramatic over a distance. 29