9.3 Graphing Quadratic Functions
150 likes | 173 Vues
Understand quadratic functions, parabolas, vertex, axis of symmetry, and graphing equations using tables and patterns. Discover how coefficients affect the shape of the graph. Practice with homework exercises and bonus questions for a comprehensive grasp.

9.3 Graphing Quadratic Functions
E N D
Presentation Transcript
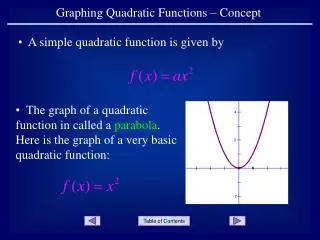
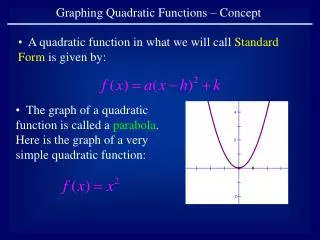
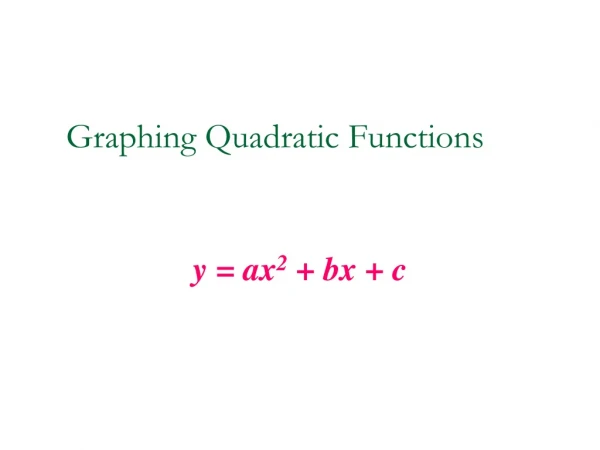
Quadratic Functions • Quadratic functions are functions written in the form • Every quadratic function has a U-shaped graph called a parabola.
y = ax2 +bx + c When a>0, the parabola opens up. The vertex is the minimum point. Positive a = smiley face Axis of Symmetry Vertex If the leading coefficient is positive, the parabola opens up, like a U.
y = ax2 +bx + c When a<0, the parabola opens down. The vertex is the maximum point. Negative a = Sad Face Axis of Symmetry Vertex If the leading coefficient is negative, the parabola opens down, like an upside-down U.
Parabolas • The lowest/highest point on a parabola is called the vertex. • The axis of symmetry is the line that runs through the vertex and divides the parabola in two symmetric parts. • The x-coordinate of the vertex, and the equation of the axis of symmetry will be the line x = -b 2a
GRAPHING QUADRATIC EQUATIONS • Make a table • Plot points and connect dots to make a smooth curve.
Quadratic Functions will be in the form y = ax2 + bx + c or f(x) = ax2 + bx + c The graph of a Quadratic Function will be a parabola.
Use the table with the given values for x to find f(x). Then graph the function • y = x2
y = 2x2 y = -2x2
Graph each function, and compare them to the graph of y = x2 y = 5x2 y = ¼ x2
y = 5x2 Do you notice any patterns here? y = x2 As the coefficient (a) of x2 gets larger, the graph gets narrower; And if the coefficient is less than 1, the graph is wide. y = ¼ x2
Homework Section 9.3Page 521, # 5-10, and # 11,12,14,15,19Plus, Box and Whisker Question on Handout (See page 375)BONUS: Do p. 378, #8-10,#15-17