SlideServe
Menu
Préférences
© SlideServe · v2026

Human Variation in Skin Color and Race as a Social Construct

josephine-gilbert avatar
15 diapositives · 362 Views · Nov 09, 2014

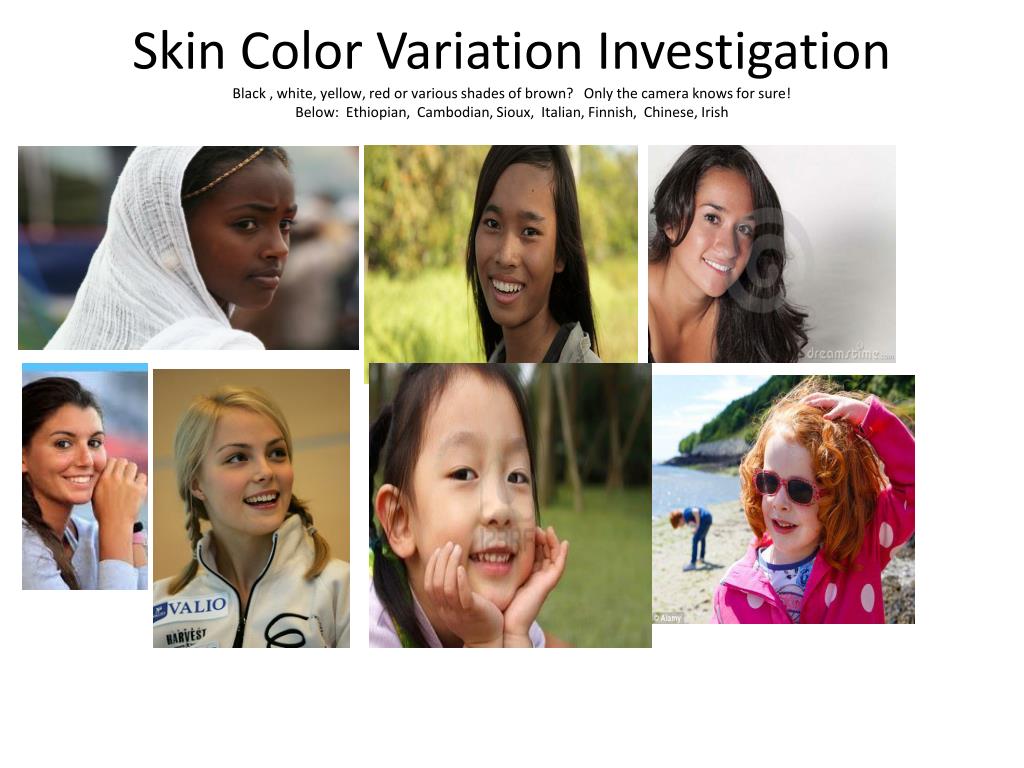
Skin Color Variation Investigation B lack , white, yellow, red or various shades of brown? Only the camera knows for sure! Below: Ethiopian, Cambodian, Sioux, Italian, Finnish, Chinese, Irish. Human Variation in Skin Color and Race as a Social Construct.
Human Variation in Skin Color and Race as a Social Construct - slide 1
01 / 15Human Variation in Skin Color and Race as a Social Construct
1 / 17

Télécharger la présentation

Human Variation in Skin Color and Race as a Social Construct
Une image / un lien ci-dessous est fourni (tel quel) pour télécharger la présentation

Politique de téléchargement : le contenu du site vous est fourni TEL QUEL pour votre information et votre usage personnel ; il ne peut être vendu, concédé sous licence ni partagé sur d’autres sites sans l’accord de son auteur.Le contenu vous est fourni TEL QUEL, pour votre information et votre usage personnel uniquement. Téléchargez la présentation en cliquant sur ce lien. Lors du téléchargement, si vous ne parvenez pas à télécharger une présentation, l’éditeur a peut-être supprimé le fichier de son serveur.Pendant le téléchargement, si vous ne parvenez pas à obtenir une présentation, le fichier a peut-être été supprimé par l’éditeur.

F I N

Plus de contenu associé

Transcription de la présentation
  1. Skin Color Variation InvestigationBlack , white, yellow, red or various shades of brown? Only the camera knows for sure!Below: Ethiopian, Cambodian, Sioux, Italian, Finnish, Chinese, Irish

  2. Human Variation in Skin Color and Race as a Social Construct • This lesson is part of evolution unit which follows heredity and genetics • The lesson is interdisciplinary in nature in that I discuss the concept of race as a social construct and the idea that there are “black, white, red, yellow” skinned people is something that people developed. It is not based on biology. Race groupings are human-made groups. • Students first learn about mixing light and how to determine black and white from an ADI analysis. They learn that red and green = yellow, etc. • They then photograph each other’s forearms and analyze the images using ADI. • We then discuss skin color as an adaptive advantage. • I reinforce the idea that people’s skin color (before there was sunscreen, folic acid, and Vitamin D supplements) was an adaptation which enabled people to survive. I point out to the students that they come from a long line of WINNERS(otherwise they wouldn’t be here!  )

  3. What observations can we make from the graphs of RGB values from photos taken of students from various backgrounds/ethnicities? • The next series of slides shows RGB values and color graphs for 5 of my students. I have included their photos and their self-described racial/ethnic group. Can you match the graph with the photo? What is the same with all of the graphs? What is different?

  4. Graph 1

  5. Graph 2

  6. Graph 3

  7. Graph 4

  8. GRAPH 5

  9. African –American #1

  10. Cambodian #2

  11. Irish, English, German #3

  12. Ecuadorian, German #4

  13. Hungarian, Czechoslovakian #5

  14. Answers • Photo #1 = graph 4 • Photo #2 = graph 5 • Photo #3 = graph 1 • Photo #4 = graph 2 • Photo #5 = graph 3