Download
1 / 1
10 likes | 202 Vues
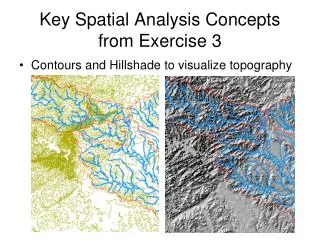
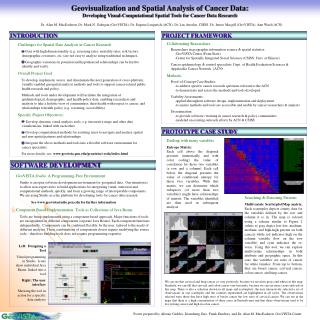
Geovisualization and Spatial Analysis of Cancer Data: Developing Visual-Computational Spatial Tools for Cancer Data Research. Dealing with many variables Entropy Matrix:

E N D
Geovisualization and Spatial Analysis of Cancer Data: Developing Visual-Computational Spatial Tools for Cancer Data Research Dealing with many variables Entropy Matrix: Each cell above the diagonal presents (numerically and with color coding) the value of correlation for those two variables (a row and a column). Each cell below the diagonal presents the value of conditional entropy for those two variables. With this matrix, we can determine which subspaces (of more than two variables) might have relationships of interest. The variables identified are then used in subsequent analysis. Searching & Detecting Patterns Multivariate Scatterplot/Map matrix. Each scatterplot depicts county data for the variables defined by the row and column it is in. The map is colored using a scheme similar to Figure 2 (white to gray depict low-low, medium-medium, and high-high percent on both cancers while red indicates high on the column variable (low on the row variable) and cyan indicates the re-verse. Using this tool, we can explore multivariate relationships in both attribute and geographic space. In this case, the variables are rates of cancer for white females. From top to bottom, they are breast cancer, cervical cancer, colon cancer, and lung cancer. Dr. Alan M. MacEachren, Dr. Mark N. Gahegan (GeoVISTA), Dr. Eugene Lengerich (ACN), Dr. Luc Anselin, CSISS. Dr. James Macgill (GeoVISTA), Ann Ward (ACN) • Challenges for Spatial Data Analysis in Cancer Research • Data with high dimensionality (e.g. screening rates, mortality rates, risk factors, demographic covariates, etc.) are not easy to analyze using traditional techniques. • Geographic variations in potential and hypothesized relationships can be hard to identify and verify. • Overall Project Goal: • To develop, implement, assess, and disseminate the next generation of cross-platform, visually-enabled geospatial analysis methods and tools to support cancer-related public health research and policy. • Methods and tools under development will facilitate the integration of epidemiological, demographic, and health-policy data, enabling researchers and analysts to take a holistic view of communities, their health with respect to cancer, and relationships to health policy (e.g. screening, accessibility). • Specific Project Objectives: • Develop dynamic visual analysis tools, e.g. interactive maps and other data visualizations, linked with each other. • Develop computational methods for assisting users to navigate and analyze spatial and non-spatial patterns and relationships • Integrate the above methods and tools into a flexible software environment for cancer specialists. • For more details, see: www.geovista.psu.edu/grants/nci-esda/index.html INTRODUCTION PROJECT FRAMEWORK • Collaborating Researchers: • Researchers in geographic information science & spatial statistics: • -GeoVISTA Center (Penn State) • -Center for Spatially Integrated Social Sciences (CSISS; Univ. of Illinois) • Cancer epidemiology & control specialists: Dept. of Health Evaluation Sciences & Appalachia Cancer Network (ACN) • Methods: • Proof-of-Concept Case Studies: • to address specific cancer research questions relevant to the ACN • to demonstrate and assess the methods and tools developed • Usability Assessments: • applied throughout software design, implementation and deployment • to ensure methods and tools are accessible and usable by cancer researchers & analysts • Dissemination: • to provide software / training in cancer research & policy communities • modeled on existing outreach efforts by ACN & CSISS PROTOTYPE CASE STUDY SOFTWARE DEVELOPMENT • GeoVISTA Studio: A Programming-Free Environment • Studio is an open software development environment for geospatial data. Our intention is to allow non-expert users to build applications for integrating visual, statistical and computational methods, quickly, and from a growing range of interoperable components. We are using Studio as a the platform for developing tools for cancer data research. • See www.geovistastudio.psu.edu for further information • Component Based Implementation: Tools as Collections of Java Beans • Tools are being implemented using a component-based approach. Major functions of tools are encapsulated in different components (separate Java Beans). Each component functions independently. Components can be combined flexibly, by the user, tailored to the needs of different analyses. These combinations of components do not require modifying the source code – therefore building tools does not require programming expertise. Left: Designing a Tool Visual programming in Studio. Icons show individual Java Beans, linked into a tool Right: The user interface Showing the tool in action for a specific data analysis We can see that cervical and lung cancer co-vary positively, because we see more grays and whites in this map. Similarly, we can tell that cervical and colon cancer vary inversely, because we can see more cyans and reds in this map. There is also a selection shown in all maps and scatterplots; the user interactively selected a set of observations in one scatterplot and the counties represented are highlighted in all views. The observations selected were those that have high rates of breast cancer but low rates of cervical cancer. We can see in the maps that there is a high concentration of these cases in Pennsylvania and that these observations tend to be low in lung cancer and high in colon cancer. Poster prepared by Alistair Geddes, Diansheng Guo, Frank Hardisty, and Dr. Alan M. MacEachren, GeoVISTA Center