Topographic Map Skills
Topographic Map Skills. What other types of information (besides Location) can maps show?. Catalyst. 1. Jelly Bean Video Reflection: What would you do differently? 2 . What method do we use to answer questions in science? 3. THINK : What types of information do we get from maps?.

Topographic Map Skills
E N D
Presentation Transcript
Topographic Map Skills What other types of information (besides Location) can maps show?
Catalyst 1. Jelly Bean Video Reflection: What would you do differently? 2. What method do we use to answer questions in science? 3. THINK: What types of information do we get from maps?
Sneak Peek: Unit 1: Geology: Were the continents always in their current positions?
FINISH: WORLD MAPS • Be able to locate the 7 continents! • The 5 major oceans! • Which ocean is LARGEST?
Latitude and Longitude • Latitude • Influences climate • Latitude = our altitude to Polaris (the North Star) • Longitude • Same longitude experiences the same time (time zones)
TIME ZONES What is a time zone? Thought Question: Why do time zones exist? Does the sun RISE and FALL at the same time in all places in the world? Even today (and especially in ancient times, people measured noon by the position of the Sun directly overhead!)
Earth rotates on its axis at 15°/hourThe Earth has a total of 360°, 24 time zones as a result of our rotation
UNITED STATES TIME ZONES What are the 4 major US time zones? • Eastern • Central • Mountain • Pacific Which one do we live in?
WEATHER MAPS: ISOTHERMS Isotherm: lines that connect areas of equal temperatures Iso= equal Therm= temperature (or heat)
Vocabulary for Success Iso Isotherm Contour lines Elevation Sea level Contour index Contour interval
Isolines • Lines that connect areas of equal value on a map • Iso = equal • Ex) isotherm map
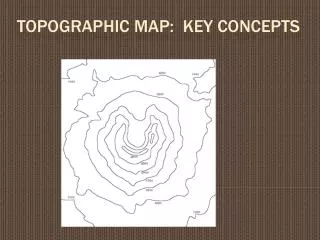
Topographic Maps • Globes, projections, & geological maps do not show all the features of the land like rivers, hills, and constructed features. • Topographic maps can show us characteristics of the land • Contour lines on the map show elevation!
Contour Lines • Contour line is a specific type of iso-line • Lines that connect points of equal elevation on a map • Elevation = height above sea level • Sea level = average height of all Earth’s oceans
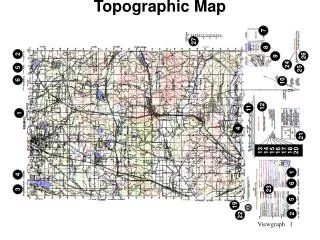
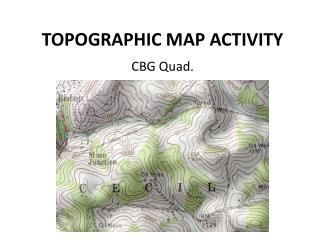
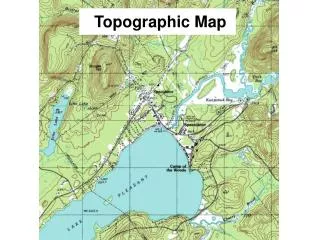
Topographic Map What do you notice about this map?
Decoding the Map • Map Scale = ratio between distances on a map and actual distances on the surface of Earth (ex. 1: 24,000) • If there were buildings on this map, how big would they be in real life? • Map Legend = explains what the symbols represent on the map
Contour Interval Contour interval – distance between contour lines on a map
Contour Index • Reference contour line whose elevation is labeled • Think: Index finger
Fast Facts • 1. Closer lines = steeper slope • 2. Depression = hole • 3. Highest elevation of a hill • Find the highest/latest contour line • Highest possible elevation is just below that of the next line
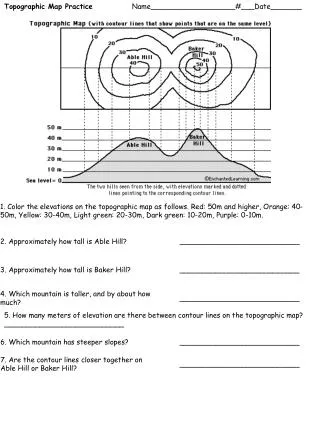
Let’s Practice: The Flag RaceContour Interval = 100 feetAt what elevation did I leave my glasses? 500 feet 100 Feet
The Flag Race Map 100 feet 500 feet
The Flag RaceContour Interval = 100 feet 500 feet Which side of the mountain would you chose to climb up? Why? 100 Feet
SLOPE STEEP Less steep
The Flag RaceContour Interval = 100 feet 500 feet Which side is less steep? 100 Feet
The Flag Race Map Which side is less steep on the map? How can we tell? What does “steepness” look like on the map? 100 feet 500 feet Let’s give these lines a name….
We call those lines… Contour line = connects points of equal elevation
The Flag RaceWhat is the elevation of your forgotten sunglasses? How do you know? We call the spaces between each line, the contour interval. Write your own definition of what “contour interval” means. 500 feet 100 Feet
The contour interval is 10… *What is the elevation of the church? *What is the elevation of the school? 240 200
The contour interval is 50… *What is the elevation of the church? *What is the elevation of the school? 300ft 100 ft
BONUS: The contour interval is 100. The x represents the elevation of the peak. What is the highest possible elevation of the peak? 100 x 500
What if we have to figure the contour interval out on our own? • Steps to calculate contour interval • Subtract the elevations of two index contour lines • Countthe number of spaces between two index contour lines • Divide the difference in elevation by the number of spaces between two index contour lines
Calculate Contour Interval • Step 1: 800 – 700 = 100 • Step 2: Count spaces: 5 • Step 3: 100/5 = 20 Contour interval = 20!
PARTNER WORK • 1. With the person sitting beside you: -Construct a landform out of Play-Doh. -It should include several different elevations. • 2. Draw a contour map of your landform. • 3. Raise your hand – when checked off: • FIND ANOTHER GROUP TO TRADE WITH! Try to construct their landform!
Find a line across a contour map • Use a piece of paper to mark off where the contour lines cross the line. • Use the paper as the x-axis of a graph with the y-axis equal to the contour interval • Plot the points and connect them with a smooth line. • A profile shows the side view of a contour map.