Download
1 / 16
160 likes | 278 Vues
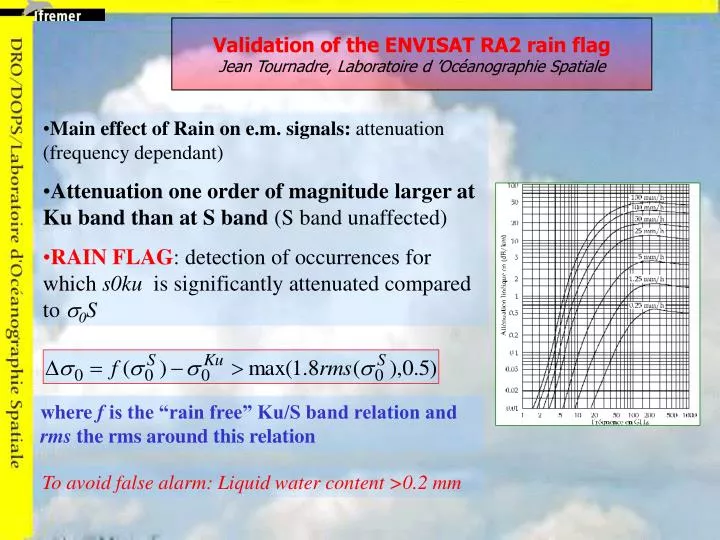
Validation of the ENVISAT RA2 rain flag Jean Tournadre, Laboratoire d ’Océanographie Spatiale. Main effect of Rain on e.m. signals: attenuation (frequency dependant) Attenuation one order of magnitude larger at Ku band than at S band (S band unaffected)

E N D
Validation of the ENVISAT RA2 rain flagJean Tournadre, Laboratoire d ’Océanographie Spatiale • Main effect of Rain on e.m. signals: attenuation (frequency dependant) • Attenuation one order of magnitude larger at Ku band than at S band (S band unaffected) • RAIN FLAG: detection of occurrences for which s0ku is significantly attenuated compared to s0S where f is the “rain free” Ku/S band relation and rms the rms around this relation To avoid false alarm: Liquid water content >0.2 mm
Example of rain effect (Topex) • Toga-Coare rain radar data • 10 min before Topex pass • Attenuation of Ku band s0 • Tracker loss • Lz not directly representative of rain
Validation of rain flag • Statistical analysis of s0 Ku and S data and their corrections • Estimation of the Ku/S band relation • Comparison with theoretical relation • Rain flagged samples (using Topex TMR data) • Examples of ENVISAT RA2 waveforms during rain event and sigma0 bloom
Statistical analysis of s0 data s0 in IGDR defined by: Mean s0 Ku ~ 8.8 dB rms ~1.8 dB , mean s0 S~8.3 dB rms~1.91 dB The histograms comparable to those of JASON
s0 corrections (instrumental and atmospheric) Atmospheric correction includes cloud liquid water (from MWR) Should not be used for rain flagging Mean correction for KU 0.13dB negligible for S Instrumental correction Mean correction for Ku band 2.5 dB and 3.13 dB for S band Distribution skewed for Ku band
Spatial variabilityof s0 Distribution of sample to sample Ds0 (Dx= 5.8km) for Ku and S band. Estimation of natural s0 variability Similar Ku and S band distributions (gaussian, 0 mean 0.5dB rms)
Ku/C band relation : s0 bidimensional pdf The data are screened for land, ice (using peakeness) and instrumental problems (~350000 samples have been used). Between 5 and 11 dB good agreement with theoretical relation (with 7 dB offset for S band and 2.7 for Ku band)
Ku/C band relation and rms • mean Ku/S band f relation and its rms computed from s0 data set. • f relation used to reject data if Ds0 > 2 rms new f1 estimated • A priori rms from Topex (green line) • Good agreement with theoretical relation with DsC=7dB DsKu=2.7dB Distributions of Ds0=s0Ku –f(s0S) and Ds0/2 rms Skewed for Ds0 (influence of rain) Gaussian for normalized Point flagged for Ds0/2rms<-1
2D distribution of s0 Ku and S band : very large dispersion for high s0 (low winds), much larger than that of TOPEX and JASON. This results from the influence of significant wave heights The f relation has been computed as a function of Ku band SWH Large differences for s0>12dB, no influence on rms
Example of small intense rain cell Characteristic V shape deformation of the waveforms (Ku) Attenuation of 1.5 dB of Ku band s0. Enhancement of S Band visible in waveforms
Strong distortion of waveforms leads to bad estimates of range (here more than 3m) Brown model no longer valid
Large rain event: Lz>1000 mm • Length > 200km with several rain cells • Attenuation of s0 >1.5dB • Some enhancement at S band • Small influence on range (to be further checked)
s0 bloom (>20dB) • Mightresult from surface slick • Characteristic V shape feature on both Ku and S band • Ku > S • No rain
~2% of the samples are rain flagged • No difference between f (red +) and f1 (black +) relation • Same %age as MWR Lz (green+)> 600mm but different location • % of flagged in 5°x5° boxes • Patterns similar to TOPEX and JASON
Conclusion/perspective • First validation : distributions of S and Ku band s0 seems OK but low Ku and S mean values • Atmospheric correction always removed; Good sample to sample variability distribution but rms to high • Ku/S s02D distributions similar to those of JASON and TOPEX • f relation very similar to theoretical one up to 12dB. Rms > Topex and Jason rms • Number of flagged samples ~2% • Results: very encouraging • Waiting for full validation of s0 and MWR Lz . • Analysis of waveforms and comparison with theoretical model to be conducted