Download
1 / 79
790 likes | 936 Vues
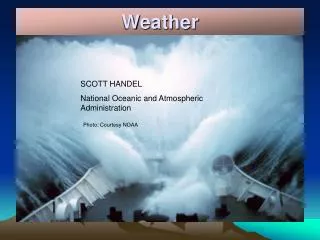
National Weather Service’s WFO - Lacrosse, Wisconsin Leadership Conference. Thursday, May 4, 2011 Charly Wells, Director OEODM NWSHDQTRS Silver Spring Maryland. Discussion Topics. Cultural Diversity Workforce Diversity Differences between EEO/AA/Diversity

E N D
National Weather Service’sWFO - Lacrosse, WisconsinLeadership Conference Thursday, May 4, 2011 Charly Wells, Director OEODM NWSHDQTRS Silver Spring Maryland
Discussion Topics • Cultural Diversity • Workforce Diversity • Differences between EEO/AA/Diversity • National Weather Service’s approach to Diversity Management • Statistical analysis of NWS workforce • What are the demographics of the NWS? How has it changed? Where is it going? • How has diversity improved our mission over the years? Examples? Stories? • How has our awareness of diversity changed over the years?How has it improved our agency and mission?
Recruitment Efforts at NOAA • Corporate Recruitment • No Specific Recruiters • Difficult to identify (Recruiters) in the Line Offices • Distribution of Announcements and Key Vacancies • Increase applicant pool • Targeted communities • Results Oriented (Wide Dissemination) • Key Minority Organizations (Specific locations based on underrepresentation) • Line Office Participation (EEO Managers) • Plan to reduce Under representation
EEO/AA/Diversity • Equal Employment Opportunity • EEO concerns legal compliance with applicable laws, regulations, and policies. • Affirmative Action(Affirmative Employment Program) • Affirmative Action concerns special recruitment and developmental efforts to overcome under-representation • Diversity(Diversity Management) • Diversity concerns maximizing and maintaining effective working relationships.
A Definition of: Diversity in the Workplace Diversity is the mixture of differences and similarities each employee brings to the workplace to accomplish the mission of the Organization.
Two Types of Diversity Cultural diversity concerns differences created in society and brought to the workplace through the hiring process Workforce diversity is limited to the boundaries of the organization. It concerns differences that are created by the organization’s own structure and culture
Intro- National/Regional Change INTRODUCTION • The 2010 Census reported 308.7 million people in the United States, a 9.7 percent increase from the Census 2000 population of 281.4 million. This report discusses population change between 2000 and 2010 for several geographic levels, including regions, states, metropolitan and micropolitan statistical areas, counties, and places. NATIONAL AND REGIONAL CHANGE • The increase of 9.7 percent over the last decade was lower than the 13.2 percent increase for the 1990s and comparable to the growth during the 1980s of 9.8 percent (Figure 1). Since 1900, only the 1930s experienced a lower growth rate (7.3 percent) than this past decade.1 • From 2000 to 2010, regional growth was much faster for the South and West (14.3 and 13.8 percent, respectively) than for the Midwest (3.9 percent) and Northeast (3.2 percent) (Table 1, Figure 2). The South grew by 14.3 million over the decade to 114.6 million people, while the West increased by 8.7 million to reach 71.9 million people—surpassing the population of the Midwest. The Midwest gained 2.5 million, increasing that region’s population to 66.9 million, and the Northeast’s gain of 1.7 million brought that region’s
Native Hawaiians and Other Pacific Islanders • New Census Bureau data show that Native Hawaiians and Other Pacific Islanders are continuing to become a growing part of our nation’s economy. Between 2002 and 2007, Native Hawaiian- and Other Pacific Islander-owned businesses saw a growth of 31 percent in number, while U.S. businesses overall only increased 18 percent between 2002 and 2007. Native Hawaiian-and Other Pacific Islander-owned businesses also saw a 52 percent increase in revenue, while total business receipts for U.S. businesses increased only 33 percent. • This glimpse into the economic activity of Native Hawaiians and Other Pacific Islanders comes from the Survey of Businesses Owners, which is conducted every five years. This survey is the only regularly collected, comprehensive economic data on Native Hawaiians and Other Pacific Islanders and provides an important look at them as entrepreneurs. • Collected for the business year 2007, the data tell how much these businesses earned, how many people they employed, and the kinds of businesses they are in. For example, construction and retail trade accounted for 44 percent of Native Hawaiian- and Other Pacific Islander-owned business receipts. • Data show that about 56 percent of all Native Hawaiian- and Other Pacific Islander businesses were owned by people of Native Hawaiian origin in 2007. Guamanian- or Chamorro-owned businesses accounted for 10 percent, Samoan-owned businesses for 8.0 percent, and businesses owned by people of Other Pacific Islander descent for 25 percent. • Future data from the survey, to be released in June, will allow you to dig deeper into the characteristics of the owners and their businesses—their age and education, sources of start up capital and more. • More information on Native Hawaiian- and Other Pacific Islander-owned firms for your geographic area is available on the Census Bureau website.
2010 Census • During the 2010 Census, questions on race and Hispanic origin were asked of every individual living in the United States. These data provide a snapshot of race and Hispanic origin in the United States. • According to the 2010 Census, 308.7 million people resided in the United States on April 1, 2010, an increase of 27.3 million people, or 9.7 percent, between 2000 and 2010. The vast majority of the growth in the total population came from increases in those who reported their race(s) as something other than White alone and those who reported their ethnicity as Hispanic or Latino. • More than half of the growth in the total population of the United States between 2000 and 2010 was due to the increase in the Hispanic population. • Between 2000 and 2010, the Hispanic population grew by 43 percent. The Hispanic population increased by 15.2 million between 2000 and 2010, accounting for over half of the 27.3 million increase in the total population of the United States. • The overwhelming majority of the total population of the United States reported only one race in 2010. • In the 2010 Census, 97 percent of all respondents reported only one race. The largest group reported White alone (72 percent). The Black or African American alone population represented 13 percent of the total population. In addition, 0.9 percent of respondents indicated American Indian and Alaska Native alone and about 5 percent identified their race as Asian alone. The smallest major race group was Native Hawaiian and Other Pacific Islander alone, representing 0.2 percent of the total population. • The examination of racial and ethnic group distributions nationally shows that while the non-Hispanic White alone population is still numerically and proportionally the largest major race and ethnic group in the United States, it is also growing at the slowest rate. • Throughout the decade, the Census Bureau will release additional information on race and Hispanic origin population groups, which will provide more insights to the nation’s racial and ethnic diversity.
What’s the Difference? • EEO – Statutory • All personnel actions free from discrimination • Enforcement mechanism • Affirmative Action – Statutory • Requires AAPs / Goals • Recruitment & Outreach • Special Emphasis – Minorities and Women • Diversity – Voluntary • Process driven/Mission Focus • Inclusive v. Exclusive • Retention / Work Environment/Employee Development
Discrimination Non Statutory Complaints EEO Effectiveness Protected Groups Civil Rights Act & Subsequent Legislation Diversity Management Process Programs/Laws Goals Inclusive Action Plans AA Retention Special Emphasis Work Environment Qualitative/Retention Quantitative/Legal Compliance The Diversity Connection
DOC Seven Diversity Tenets Inclusion Opportunity Comprehensiveness Accessibility Training Management Evaluation The late Ron Brown (2/22/94) stated that “Diversity is the key to the future success of the Department of Commerce. We are charged with effectively competing in a world-wide arena and, if we are to succeed in that competition, each of us must embrace the value of diversity as being critical to the achievement of our mission” NOAA’s Five Phase approach to Managing Diversity(Dr. Roosevelt Thomas) Advocacy Getting stake holder to buy the concepts and process. Diagnostic Discovering where the organization is today. Planning Determining where the organization wants to go and what is available to help it get there. Implementation Determining the mechanisms for change. Feedback Measuring and setting actions for continuous improvement. Managing the Diversity Life Cycle – The process is continuous as the organization pursues an organizational culture change process of improving the work environment for all employees. The managing diversity initiatives listed do not represent static actions that can be checkedoff a list. Background look at Diversity Management @ DOC & NOAA
NWS Diversity Management Strategic Plan • Examine – the current culture of the organization (how we treat our employees) • Understand – NOAA’s NWS definition of Diversity Management and the positive impact of an inclusive work environment. Identify areas where improvement is vital to the success of the organization(people relationships) • Engage– the entire workforce (Senior Managers to employees) in creating an atmosphere in which each employee can reach their full potential and feel valued in the workplace • Evaluate– work relationships that work and those that need improvement. Reward success and recognize failures to determine best practices
Why are the Top Ten Offices Doing so Well? • Better Science and Technology? No. • Easier Verification? No. • Easier Storms? No. • More Practice? No. • Better at Diversity Management???
Hypothesis A tornado warning is arguably the most challenging of all products issued by NWS forecasters. Sustained, high performance in tornado warnings, requires a highly-trained, dedicated staff who can work well as a team under very stressful conditions. If the benefits of an inclusive, supportive, and flexible work environment, where managers foster personal development, teamwork and empowerment, among their employees, are to be seen, it would be in tornado warning verification statistics. Offices that score high in tornado warning verification statistics will also score high in SFA results compared to offices with poor tornado verification statistics.
Methodology • Obtained 2000 & 2001 Tornado Warning Statistics for each NWS forecast office • Ranked all forecast offices by skill • Requested a special aggregate report of NOAA’s all-employee survey (SFA) for the Top 10 and Bottom 10 forecast offices in skill • Compared the two reports for significant differences
Findings from Phone Interviews of Top Ten Forecast Offices • Manager leadership demonstrated through action (working shifts, severe weather) often in a subordinate role • Managers do not micro-manage severe weather operations • Some managers had anti-role models • Managers back up their forecasters’ decisions • Managers foster open dialog • Managers are careful in hiring people to enhance the existing team (consider both skills and personality) • Office commitment to improvement
Findings from Phone Interviews of Top Ten Forecast Offices • Managers work closely with the union representatives • Managers support family/personal needs • Offices seem to have low staff turnover • Managers have strong focus on making the work satisfying and enjoyable for their employees • Managers work to make sure that all employees are appreciated (both mets and non-mets) • Managers reward quickly and often • Management team support manager’s goals
NWS Forecast Offices and Regions * * Offices west of the Rockies were excluded from our analyses, as well as those reporting fewer than five tornado events in 2001/2002 and those with fewer than five employees completing the survey.
Weather Forecast Office (WFO) Culture Characteristics • “Family” unit of 20-30 people, isolated from other offices • Relatively homogenous in gender, ethnicity, age • Experienced (10-25 yrs) • Unionized – can be contentious • High value placed on Science and Technology and Dedication to Mission
Which Storms are Tornadic? Has the radar identified a strong storm? Are there signs of rotation in the storm? Are there spotter reports of a funnel with the storm? Have other storms in the area produced tornadoes? Where is the storm heading? Will it remain tornadic?
Key Measures on 50 WFOs • Data for 50 Weather Forecast Offices: • Critical Success Index (CSI) – key measure of tornado warning performance that combines hits, misses, and false alarms • Hits: Number of positive forecasts followed by an event occurrence • Misses: Number of occurrences that were not predicted • False Alarms: Number of positive forecasts that were not accompanied by an event • Sick leave hours per month per employee • Employee Satisfaction – from a Sirota survey of 12,000 National Oceanic and Atmospheric Administration (NOAA) employees • Conducted as part of a diversity strategy • Approximately 130 multiple-choice questions • Administered through February of 2002
Key Measures on 50 WFOs (continued) • Data on 50 Weather Forecast Offices (continued): • Controlled variables– several variables thought to affect tornado warning performance accuracy were statistically controlled for: • Employee tenure • Education level • Number of employees at each site • Geography • Number of tornado events • F-Scale of tornadoes • Other potential influences were comparable across the offices: • Technology • Training opportunities
Variation in CSI Scores Across Offices Research Question: How do we explain these CSI performance differences for tornado warnings across WFO’s? 10 8 6 Number of Weather Forecasting Offices 4 2 0 .063 - .105 .190 - .233 .233 - .275 .318 - .360 .360 - .403 .445 - .488 .105 - .148 .148 - .190 .275 - .318 .403 - .445 Poor Performance Better Performance
Highest Correlates of Tornado Warning Performance r Sick leave hrs per month per employee (actual sick leave hours per month) -0.45 ** My last performance appraisal was on schedule 0.42 ** Reasonable accommodations are made for persons with disabilities (e.g., availability of sign language interpreters, ramps, Braille) 0.38 ** I know the process for voicing a complaint or filing a grievance through the union 0.36 ** In my Line/Staff Office, work practices and procedures that are no longer needed are eliminated 0.34 ** I understand the relationships between the NOAA Line/Staff Offices 0.30 * Differences among individuals are understood and accepted (e.g., gender, race, religion, age, sexual orientation, disability) 0.28 * Diverse groups (e.g., work teams, customers) participate in the development of performance measures where I work 0.28 * The results of the 1998 SFA were used constructively by management 0.26 * I know where to find information concerning my rights as a federal employee 0.25 * I know how to contact the appropriate union official if I need to 0.24 * I understand that the union is the exclusive representative of NWS bargaining unit employees 0.24 * Pairwise n = 50; * p < .05; ** p < .01
Regression Analysis Nearly half of the differences in WFOs’ performance are accounted for by four variables: Unknown factors Sick leave Performance appraisal on schedule Know process for voicing complaint through union Accommodations for disabled * Results based upon stepwise regression analysis
Highest Survey Correlates of Sick Leave • A clear pattern of relationships emerges: • Work group cooperation and teamwork • Within work groups (r = -0.30 *) • Between work groups (r = -0.41 **) • Supervisor behavior • Responsive to employee ideas (r = -0.40 **) • Fair (r = -0.36 *) and Supportive (r = -0.35 *) • Relationship with union representative (r = -0.40 **) • Performance and diversity • In other words . . . • WFO culture has a strong and consistent impact on sick leave • And, ultimately on make argertornado warnings * p < .05; ** p < .01
Performance Enablement Employee Relations Conceptual Model Survey data HR data Performance appraisal on schedule 0.283* Accommodations for disabled 0.310* CSI (Performance) 0.263* Know process for voicing complaint through union -0.355* Sick leave The most important factors in tornado warning performance reflect managerial effectiveness: Performance Orientation and Employee Relations * Values are Standardized Beta coefficients
NWS Tornado Warning Performance CSI Trend Line 2007 NWS Goal X CSI Score
NWS Tornado Warning Performance WFOs performing best on cultural variables have reached the NWS goal four years ahead of schedule: Top Third of WFOs on Culture Index* 2007 NWS Goal .34 X CSI Score .21 Bottom Third of WFOs on Culture Index* *The Culture Index comprises the following items: Performance appraisal on schedule, Accomodations for disabled and Know process for voicing complaint through union
Conclusions • Improvements in technology are extremely important to improve tornado warning performance. They promise to raise the performance of all offices. • In addition, we have found that leadership in individual National Weather Service offices also has a demonstrable impact on performance. • In fact, the quantitative goal of excellence the National Weather Service has set for itself could be achieved by attending to these cultural variables alone.
Conclusions (cont.) • Where diversity is managed better, a better job is done carrying out the National Weather Service mission! • Where diversity is managed better, the cost of carrying out the National Weather Service mission is reduced! • SFA 2002 results show that the National Weather Service should focus on aligning the management practices in the all our offices with the NOAA Diversity Vision. An improvement strategy based only on science and technology without an aggressive diversity management component is likely to fall short of the mark. • This is the Business Case for Diversity Management for NOAA’s National Weather Service
___ __________ CULTURE _______ __ __________ CULTURE _______ Flexible Policies/Procedures Teamwork Open Communication Focus on Performance Goals Set and Tracked Strong Customer Orientation Emphasis on Innovation Trust and Respect Good Relations with Union Rigid Policies/Procedures Unresolved Conflict Climate of Fear Lack of Empowerment Poor Sense of Goals Lack of Customer Focus Resistance to Change Ignorance of Diversity Issues Poor Relations with Union Highly Accurate Warnings Low Sick Leave Moderately Accurate Warnings High Sick Leave
What does Diversity have to do with it?Isn’t high performance just the result of leadership and good management?
TRADITIONAL LEADERSHIP: The burden of accommodation falls on the employees. They must accommodate the style and preferences of the manager.DIVERSITY-BASED LEADERSHIP: The manager and employees work together to accommodate the styles and preferences of everyone.
That was 2003.What about nowin 2009?Do the conclusionsstill hold?Answer: Yes!
Performance vs Culture Index Change to Storm-based Tornado warnings TOP 1/3 MID 1/3 BOTTOM 1/3
Performance vs Culture Index Change to Storm-based Tornado warnings TOP 1/3 TORNADO ALLEY WFOs