Download
1 / 48
490 likes | 739 Vues
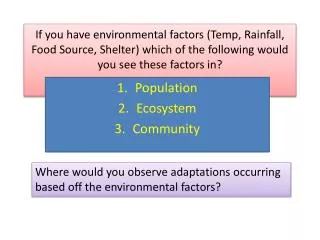
Levels of Organization Organism Population Community Ecosystem Biome. 1. 2. 3. 4. Population Ecology. Population ecology is the study of populations in relation to environment

E N D
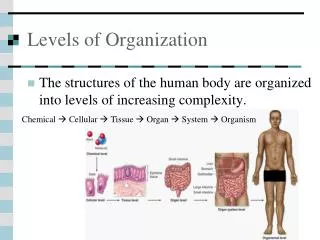
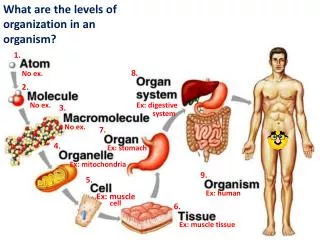
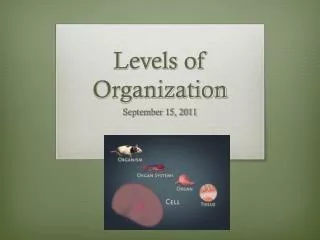
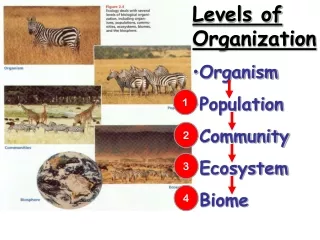
Levels of Organization • Organism • Population • Community • Ecosystem • Biome 1 2 3 4
Population Ecology • Population ecology is the study of populations in relation to environment • Including environmental influences on population density and distribution, age structure, and variations in population size
Describing populations What is a population? What are the components/characteristics of a populations?
Population Ecology Topics • Size • Density • Dispersion • Survivorship Curves • Age Structure Diagrams • Growth • Exponential, Logistic, Carrying Capacity, Limiting Factors (density dep, density indep), Growth Patterns (R and K strategists).
Describing populations • Size: total # of individuals in a pop (N) • Density: # / unit area
Describing populations How big is a population? Estimation of Population Size Sampling technique • Mark and recapture
Describing populations Mark and Recapture • Orgs are captured, tagged, and then released. • Some time later, the same process is repeated and the following is used:
Describing populations • Ex: • Suppose that 50 zebra mussels are captured, marked, and released. One week later, 100 zebra mussels are captured and 10 are found to have markings already. The estimated population would then be • N= (50·100) / (10) = 5000/10 = 500 • N=500
Describing populations How do populations space themselves? Dispersion • Describes how individuals in a population are distributed in the environment • Clumped • Uniform • Random
Clumped dispersion (most common) Individuals aggregate in patches May be influenced by resource availability & behavior Describing populations • Example: • For many animals, such as these wolves, living in groups (packs) • increases the effectiveness of hunting. • spreads the work of protecting and caring for young. • helps exclude other individuals from their territory. Fish travel in schools – safety in numbers
Uniform dispersion -Individuals are evenly distributed -May be influenced by social interactions such as territoriality Describing populations Birds nesting on small islands, such as these king penguins on South Georgia Island in the South Atlantic Ocean, often exhibit uniform spacing, maintained by aggressive interactions between neighbors. Some plants secrete toxins that keep others away
Random dispersion The position of each individual is independent of other individuals Describing populations Dandelions grow from windblown seeds that land at random and later germinate.
Describing populations How do populations change over time? Changes in Population Size Biotic potential of a population= • max rate at which a population could increase under ideal conditions • Influenced by several factors: • Age at which reproduction begins • Life span during which the organisms are capable of reproducing ( # of reproductive years) • Number of reproductive periods in the lifetime • Number of offspring the organism is capable of having
Description of the abundance of individuals of each age in a population. Can show changes in a population Age Structure Describing populations
2004 China India United States Animation
Describing populations 1000 100 Number of survivors (log scale) Females 10 Males 1 2 8 10 4 6 0 Age (years) Survivorship Curves • Describes how the mortality of individuals in a species varies during their lifetime The survivorship curve for Belding’s ground squirrels • Shows that the death rate is relatively constant
1,000 I 100 Number of survivors (log scale) II 10 III 1 100 50 0 Percentage of maximum life span • Type I • A species in which most survive to middle age • Parenting • Type II • Length of survivorship is random. Death rate is constant. • Survivorship curves can be classified into three general types:Type I, Type II, and Type III • Type III • Most individuals die young. • Few reach reproductive maturity. • Fish release 1000s of eggs. • No parenting Animation
Survivorship Curves 1) Which curve would fit an organism that cares for its young and reproduces relatively late in life? Type I 2) Which curve would be typical of an organism that experiences high predation as small individuals but when they are adults are more able to avoid most predators? Type III 3) Which curve might best fit rodents that die in numbers at all ages? Type II
Factors Affecting Population Limiting Factors • Things that prevent a population from attaining its biotic potential • 2 categories • Density-dependent • Density-independent Density Dependent Density Independent
Factors Affecting Population Density Dependent Populations regulated by density-dependent factors areaffected by thenumberof organisms present. • Predation • Parasitism • Disease • Competition -the more organisms crowd together, the more damaging are food shortages, parasites, and predators. Intraspecific Competition= the struggle between members of a population for scarce resources
Factors Affecting Population Density Independent • The number of organisms present does not affect the influence of the factor. • Fire, earthquakes, storms, floods • Density-independent factors show no correlation with the size of the population.
Describing Population Growth Population ecologists describe two general patterns of populations growth: • Exponential • Logistic
Types of Population Growth The growth of a population can be described by the following equation: • r= reproductive rate (or population growth) • N= population size at the beginning of the interval for which the births and deaths are counted. rmax = . Net increase of individuals births-deaths N maximum population growth rate..growth rate-This is also known as the “per capita reproduction rate”…. Population size
Exponential growth r>0 Types of Population Growth In a population showing exponential growth the individuals are notlimited by food, disease, predation or competition. If the rate of reproduction per individual remains constant through time, then the rate at which the population increases is a multiple of the number of individuals in the population.
Exponential population growth • Results in a J-shaped curve • Usually short lived in nature- not sustainable r>0 Types of Population Growth 2,000 dN 1.0N dt 1,500 dN 0.5N dt Population size (N) 1,000 500 0 0 10 15 5 Number of generations Also called per capita growth rate: dN/dt= rmaxN Population size (N) dN/dt = new population size r= growth rate N= population size Mr. Anderson
Exponential population growth rmax = births-deaths N % growth per capita Ex: • A population of 1000 had 60 births and 10 deaths over a one year period. It is experiencing exponential growth. • What is the growth rate (rmax)? • 0.05 per year = 5% • What will be the population next year? • (dN/dt =rN) • rN= 50 new individuals • 1000 + 50 =1050 # of individuals added to population
Exponential population growth A population is experiencing exponential growth. Population size = 50 Births = 10 Death = 4 A. Calculate the per capita growth rate (rmax). • r = (B-D)/N = (10-4)/50 = 0.12 B. Calculate the population growth rate. (Individuals added to the population in one generation.) • dN/dt= rmaxN, so 0.12 x 50 = 6 C. What will be the population the next year? • 50+6= 56
Exponential population growth A population has no limits on food, resources, or space: Population size = 500 Births = 240 Deaths = 170 A. Calculate the r for this population if it is experiencing exponential growth. • Answer: 0.14 B. How many individuals will be in the population at the start of the second generation? • Answer: 14 x 500 = 70 + 500 = 570
Problem Exponential population growth • There are 300 falcons living in a certain forest at the beginning of 2013. Suppose that every year there are 50 falcons born and 30 falcons that die. • What is the population growth rate? • What is the per capita growth rate? • How many individuals will there be next year? • 20 • 0.067= 6.7% • 320 Growth rate r = births-deaths N
the real world Types of Population Growth Carrying Capacity (K) • Populations usually reach a carrying capacity. • Upper limit to the number of individuals the environment can support.
Types of Population Growth Logistic growth In most real populations both food and disease become important as conditions become crowded. • A population can grow exponentially only for short periods of time, because it would very quickly deplete all the resources necessary for its survival. • Over long periods of time, populations tend to attain an equilibrium population size which is determined by the available resources. Animation Mr. Anderson
Logistic population growth A population is experiencing logistic growth. Population size = 50 Growth rate is 0.12 Carrying capacity = 400 A. Calculate the population growth rate. (Individuals added to the population in one generation.) • dN/dt= rN [(K-N)/K] = 0.12 x 50 x [(400-50/400)] = 5.25 B. This is the same growth rate (r-per capita) as our exponential growth practice problem. Why is there a difference in the population growth rate (dN/dt )? • The 1st pop. was experiencing exponential growth and the growth rate was not affected by the availability of resources like space, food, disease, or ability to find mates. This pop. was affected by the carrying capacity and this reduced the number of individuals added to the next generation.
Logistic population growth A population B is experiencing logistic growth. Population size = 500 Growth rate= 0.14 Carrying capacity = 1000 A. How many individuals would be in the population at the start of the second generation. • 14 x 500 x [(1000-500)/1000] = 35 + 500 = 535 B. How many individuals would be in the population at the start of the third generation. • 570
Life-history strategies Logistic and exponential growth are associated with 2 kinds of life-history strategies • R-selected species (strategists) • organisms are opportunistic; they reproduce rapidly when the environment is uncrowned and resources are vast • K-selected species (strategists) • operate at a density near K Animation
Life-history strategies R-selected species a. Opportunistic species, which tend to be colonizers. b. Grasses, many insects -Usually quickly invade, reproduce many offspring and die -Offspring mature quickly and require very little parental care c. Strategies for continued existence is based on individuals having the following traits: 1) small size 2) short life span 3) mature fast 4) produce many offspring 5) engage in little care of offspring
Life-history strategies K-selected species • sensitive to population density Such populations are equilibrium species, tend to be specialists rather than colonizers, and may become extinct when their evolved way of life is disrupted (e.g., the grizzly bear, Florida panther, etc.). Overall strategy for continued existence is based on having the following traits: 1) large size 2) long life span 3) slow to mature 4) produce few offspring 5) expend considerable energy in care
Human Population Growth The following made exponential growth possible • Increases food supply • Reduction in disease • Reduction in human waste • Expansion of habitat As of 12 April 2016 (@ 1:15pm), the human population of the world is estimated to be 7,415,089,605.
Countries Ranked by Population: 2010 Source: U.S. Census Bureau, International Data Base. 6,817,500,000