
SlideServe
Menu
Préférences
© SlideServe · v2026

Surface-Enhanced Raman Scattering (SERS)

joylyn avatar
19 diapositives · 2.9K Views · Sep 10, 2014

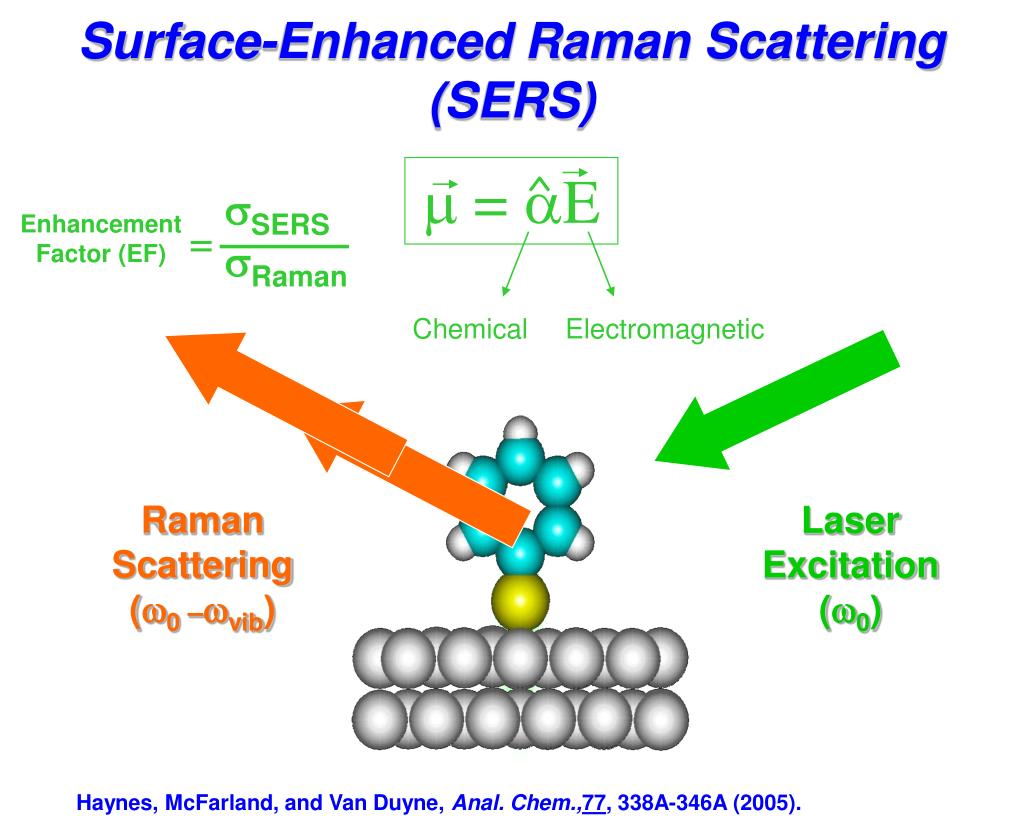
m = a E. s SERS s Raman. Enhancement Factor (EF). =. Chemical. Electromagnetic. Surface-Enhanced Raman Scattering (SERS). Raman Scattering ( w 0 – w vib ). Laser Excitation ( w 0 ). Haynes, McFarland, and Van Duyne, Anal. Chem., 77 , 338A-346A (2005). SERS Enhancement Mechanisms.
Surface-Enhanced Raman Scattering (SERS) - slide 1
01 / 19Surface-Enhanced Raman Scattering (SERS)
1 / 17

Télécharger la présentation

Surface-Enhanced Raman Scattering (SERS)
Une image / un lien ci-dessous est fourni (tel quel) pour télécharger la présentation

Politique de téléchargement : le contenu du site vous est fourni TEL QUEL pour votre information et votre usage personnel ; il ne peut être vendu, concédé sous licence ni partagé sur d’autres sites sans l’accord de son auteur.Le contenu vous est fourni TEL QUEL, pour votre information et votre usage personnel uniquement. Téléchargez la présentation en cliquant sur ce lien. Lors du téléchargement, si vous ne parvenez pas à télécharger une présentation, l’éditeur a peut-être supprimé le fichier de son serveur.Pendant le téléchargement, si vous ne parvenez pas à obtenir une présentation, le fichier a peut-être été supprimé par l’éditeur.

F I N

Plus de contenu associé

Transcription de la présentation
  1. m = aE sSERS sRaman Enhancement Factor (EF) = Chemical Electromagnetic Surface-Enhanced Raman Scattering (SERS) Raman Scattering (w0 –wvib) Laser Excitation (w0) Haynes, McFarland, and Van Duyne, Anal. Chem.,77, 338A-346A (2005).

  2. SERS Enhancement Mechanisms • Chemical Mechanism: • Laser excites (a) new electronic states arising from • chemisorption or (b) shifted or broadened adsorbate • electronic states yielding a resonance condition. • Short range (1-5 Å) • No roughness requirement • Contributes EF ~ 102 – 104 • Electromagnetic Mechanism: • LSPR induces large electromagnetic fields at roughened • metal surface where molecules are adsorbed. • Long range (2-4 nm) • Affected by all factors determining LSPR • Contributes EF > 104

  3. Localized Surface Plasmon Resonance Non-resonant Resonant • Resonant l is absorbed • EM fields localized at nanoparticle surface

  4. Nanostructured Substrates http://pubs.acs.org/cgi-bin/article.cgi/ancham-a/0000/77/i17/pdf/905feature_vanduyne.pdf

  5. Localized Surface Plasmon Resonance The resonance results in (1) wavelength-selective extinction and (2) enhanced EM fields at the surface. Spectral location of the LSPR is dependent upon particle size, shape, composition, and dielectric environment.

  6. 20 mm Resonant Rayleigh Scattering Light that is elastically scattered due to the LSPR can be used as an in situ monitor of nanoparticle optical properties. The primary benefit of scattering spectroscopy is that the single-to-noise ratio is much higher than extinction spectroscopy when examining single nanoparticles.

  7. 1 0 0 0 1 0 0 0 8 0 0 8 0 0 y t i s y n t e i s t n n 6 0 0 I 6 0 0 e g t n n i I r e g t n t 4 0 0 i a 4 0 0 r c e S t t a c 2 0 0 S 2 0 0 0 0 4 0 0 5 0 0 6 0 0 7 0 0 8 0 0 9 0 0 4 0 0 5 0 0 6 0 0 7 0 0 8 0 0 9 0 0 Wavelength (nm) 1 0 0 0 1 0 0 0 8 0 0 y t i 8 0 0 s n y e t i t 6 0 0 s n I n g e n t 6 0 0 i n r I e 4 0 0 t g t a n c i r S e 4 0 0 t t 2 0 0 a c S 2 0 0 0 4 0 0 5 0 0 6 0 0 7 0 0 8 0 0 9 0 0 0 4 0 0 5 0 0 6 0 0 7 0 0 8 0 0 9 0 0 Wavelength (nm) Measuring the LSPR

  8. 100 640 A B 588.0 600.8 510.2 574.2 611.9 80 l = 203.1*RI + 306.5 600 max y ) t 60 m i s n n ( 560 e t x a n l m I 40 520 20 480 0 450 500 550 600 650 700 1 1.2 1.4 1.6 Refractive Index Wavelength (nm) LSPR Dielectric Response Blue = N2 (1.000), Green = Methanol (1.329), Red = 1-Propanol (1.385), Purple = Chloroform (1.446), Orange = Benzene (1.501)

  9. Single Nanoparticle Sensing – Proof of Concept Wide-field Image

  10. Biosensing with Single Nanoparticles http://relic.bio.anl.gov Biotin: Vitamin H Ka = 1014 M-1 Streptavidin: 60kDa Tetrameric Protein ~4 nm x 4 nm x 5nm

  11. 508.0 520.7 Biosensing with Single Nanoparticles Monitoring Biotin-Streptavidin Binding with Single Nanoparticles 1200 800 y t i s n Dlmax = +12.7 nm Conc = 10 nM SA ~700 SA molecules e t n I 400 0 450 500 550 600 Wavelength (nm)

  12. Comparison of Unenhanced and Enhanced Raman Spectra

  13. Relationship between the LSPR and Laser Wavelength lmax = 690 nm 1575 cm-1 band N = 13 points Range = 475 – 700 nm High = 662 nm EF = 1.9 x 10⁷

  14. Locating Landmines with SERS Roughened Au lex = 785 nm Sylvia, J. M. et al. Anal. Chem. 2000, 72,5834.

  15. Locating Landmines with SERS 115 mW 30 sec TNT DNT DNB Sylvia, J. M. et al. Anal. Chem. 2000, 72,5834.

  16. Are you getting the concept? Why hasn’t surface-enhanced Raman replaced normal Raman completely? In other words, why would someone do a normal Raman scattering experiment?

  17. Single Molecule SERS EF= 1014-1015 ! S. Nie, et. al. Science 1997, 275, 1102-1106 K. Kneipp, et. al. Phys. Rev. Lett. 1997, 78, 1667-1670

  18. Hyper Raman and Surface-Enhanced Hyper Raman Spectroscopy With focused, pulsed laser, you can induce a non- linear interaction: Incident: n0 Scattered: 2n0, 2n0±n1 Selection Rules: All IR active modes are also hyper-Raman active Some hyper-Raman active modes are neither IR or Raman active

  19. Coherent Anti-Stokes Raman Phase-match wp and ws in a four wave mixing process: Incident: np, ns Scattered: 2np - ns ICARS ~ Ip2Is Large signal when: np-ns = D D CARS Advantage: The nAS signal beam is spatially and temporally removed from the fluorescence signal.