Lucid and Testable Hypotheses: Importance and Application in Controlled Experiments
This article explores the significance of lucid and testable hypotheses in controlled experiments, particularly in HCI research. It highlights how such hypotheses provide clear and convincing results on specific issues, offering insights into cognitive processes and human performance limitations. The article also discusses the importance of controlling bias, statistical analysis, interpretation of results, and the limitations of statistical significance.

Lucid and Testable Hypotheses: Importance and Application in Controlled Experiments
E N D
Presentation Transcript
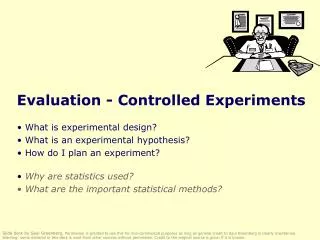
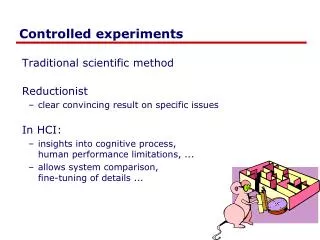
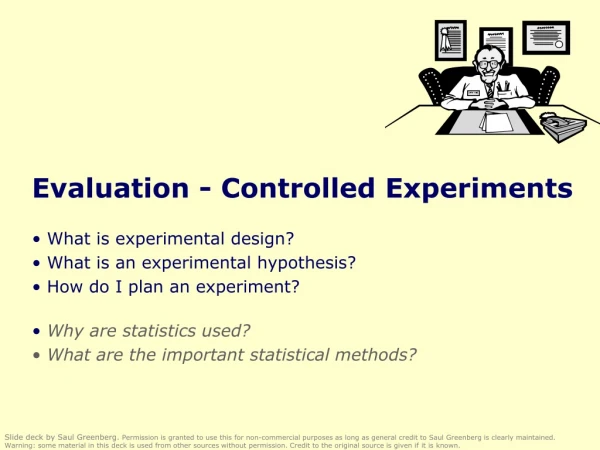
Controlled experiments • Traditional scientific method • Reductionist • clear convincing result on specific issues • In HCI: • insights into cognitive process, human performance limitations, ... • allows system comparison, fine-tuning of details ...
Lucid and testable hypothesis • State a lucid, testable hypothesis • this is a precise problem statement • Example 1: There is no difference in the number of cavities in children and teenagers using crest and no-teeth toothpaste when brushing daily over a one month period
File Edit View Insert New Open Close Save Lucid and testable hypothesis • Example 2: There is no difference in user performance (time and error rate) when selecting a single item from a pop-up or a pull down menu of 4 items, regardless of the subject’s previous expertise in using a mouse or using the different menu types File New Edit Open View Close Insert Save
Independent variables • in toothpaste experiment • toothpaste type: uses Crest or No-teeth toothpaste • age: <= 11 years or > 11 years • in menu experiment • menu type: pop-up or pull-down • menu length: 3, 6, 9, 12, 15 • subject type (expert or novice)
Dependent variables • in menu experiment • time to select an item • selection errors made • time to learn to use it to proficiency • in toothpaste experiment • number of cavities • preference
Subject Selection • Judiciously select and assign subjects to groups • ways of controlling subject variability • reasonable amount of subjects • random assignment • make different user groups an independent variable • screen for anomalies in subject group • superstars versus poor performers
Controlling bias • Control for bias • unbiased instructions • unbiased experimental protocols • prepare scripts ahead of time • unbiased subject selection Now you get to do the pop-up menus. I think you will really like them... I designed them myself!
Statistical analysis • Apply statistical methods to data analysis • confidence limits: • the confidence that your conclusion is correct • “the hypothesis that computer experience makes no difference is rejected at the .05 level”means: • a 95% chance that your statement is correct • a 5% chance you are wrong
Interpretation • Interpret your results • what you believe the results really mean • their implications to your research • their implications to practitioners • how generalizable they are • limitations and critique
Example: Differences between means Condition one: 3, 4, 4, 4, 5, 5, 5, 6 • Given: • two data sets measuring a condition • height difference of males and females • time to select an item from different menu styles ... • Question: • is the difference between the means of this data statistically significant? • Null hypothesis: • there is no difference between the two means • statistical analysis: • can only reject the hypothesis at a certain level of confidence Condition two: 4, 4, 5, 5, 6, 6, 7, 7
Example: mean = 4.5 3 • Is there a significant difference between these means? 2 1 Condition one: 3, 4, 4, 4, 5, 5, 5, 6 0 3 4 5 6 7 Condition 1 Condition 1 3 mean = 5.5 2 1 Condition two: 4, 4, 5, 5, 6, 6, 7, 7 0 3 4 5 6 7 Condition 2 Condition 2
Problem with visual inspection of data • Will almost always see variation in collected data • Differences between data sets may be due to: • normal variation • eg two sets of ten tosses with different but fair dice • differences between data and means are accountable by expected variation • real differences between data • eg two sets of ten tosses for with loaded dice and fair dice • differences between data and means are not accountable by expected variation
Statistical vs practical significance • When n is large, even a trivial difference may show up as a statistically significant result • eg menu choice: mean selection time of menu a is 3.00 seconds; menu b is 3.05 seconds • Statistical significance does not imply that the difference is important! • a matter of interpretation • statistical significanceoften abused and used to misinform
T-test • A simple statistical test • allows one to say something about differences between means at a certain confidence level • Null hypothesis of the T-test: • no difference exists between the meansof two sets of collected data • possible results: • I am 95% sure that null hypothesis is rejected • (there is probably a true difference between the means) • I cannot reject the null hypothesis • the means are likely the same
Different types of T-tests • Comparing two sets of independent observations • usually different subjects in each group • number per group may differ as well Condition 1 Condition 2 S1–S20 S21–43 • Paired observations • usually a single group studied under both experimental conditions • data points of one subject are treated as a pair Condition 1 Condition 2 S1–S20 S1–S20
Different types of T-tests • Non-directional vs directional alternatives • non-directional (two-tailed) • no expectation that the direction of difference matters • directional (one-tailed) • Only interested if the mean of a given condition is greater than the other
T-test... • Assumptions of t-tests • data points of each sample are normally distributed • but t-test very robust in practice • population variances are equal • t-test reasonably robust for differing variances • individual observations of data points in sample are independent • must be adhered to • Significance level • should decide upon the level before you do the test • typically stated at the .05 or .01 level
Dvorak Qwerty S11-S20 cannot S1-S10 touch type can S31-S40 S21-S30 touch type Analysis of Variance (Anova) • Compares relationships between many factors • Provides more informed results considers the interactions between factors • t-test for 2 means is degenerate case • example • beginners type at the same speed on both keyboards, • touch-typist type faster on the qwerty
ANOVA Example The Perceptual Structure of Multidimensional Input Device Selection