School Data Systems for Objective Decision Making on School Climate and Safety
Discover how collecting and analyzing data through school safety surveys and discipline data systems can help teams make informed decisions about school climate and safety.

School Data Systems for Objective Decision Making on School Climate and Safety
E N D
Presentation Transcript
School Teams Must Have Immediate Access to Data to Make Objective Decisions About School Climate & Safety -,Where to Start?
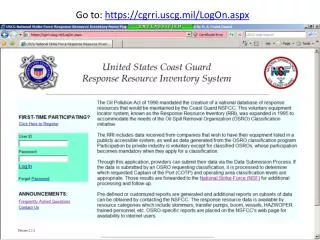
https://www.pbisapps.org/Applications/Pages/PBIS-Assessment.aspx
Information Systems for Data-Based Decision Making Desired Outcomes: School Safety Survey (SSS) Suspensions, Expulsions, Remands Office Discipline Referrals (ODRs) Fidelity of Implementation: School-wide Evaluation Tool (SET) Self Assessment Survey (SAS) Benchmarks of Quality (BOQ)
Information Systems for Data-Based Decision Making Desired Outcomes: School Safety Survey (SSS)
School Safety Survey (SSS) Data Collection Protocol • Collected annually – usually in the spring. • Completed by all adults in the school • Completed by a representative sample of students at each school. (Each homeroom teacher at grades four and above select 4 students in his/her homeroom who represent the range of academic performance of his/her students: e.g. one student who is advanced, two students who are proficient, and one who is not proficient) • Students in grades 4 and 5 take a different version of the survey that provides more extensive explanation of questions Overview The School Safety Survey (SSS) is a web-based instrument developed to obtain an efficient index of perceived school safety.The SSS provides a summary of "risk factors" and "protective factors" that are used to determine training and support needs related to school safety and violence prevention
Section 1: Risk Factors School Safety Results
Information Systems for Data-Based Decision Making Desired Outcomes: School Safety Survey (SSS) Suspensions, Expulsions, Remands
Information Systems for Data-Based Decision Making Desired Outcomes: School Safety Survey (SSS) Suspensions, Expulsions, Remands Office Discipline Referrals (ODRs)
Essential Data for School-Based Decision-Making • Referrals byproblem behavior? • What problem behaviors are most common? • Referrals bylocation? • Are there specific problem locations? • Referrals bytime of day? • Are there specific times when problems occur? • Referrals bystudent? • Are there many students receiving referrals or only a small number of students with many referrals?
Why Collect Discipline Information? • Objective decision-making • Professional accountability – confirm interventions are effective/successful • Decisions made with data (information) are more likely to (a) be implemented and (b) be effective
SWIS (School-wide Information System) • Web-based information system for gathering and summarizing problem behavior information. • Summarizes office discipline referral information by (a) how often, (b) where, (c) when, (d) what, and (e) who. • Summaries provided in tables and graphs. • Confidentiality protected. • $300 per school per year annual fee for SWIS. Additional $100 for SWIS-CICO TM.
Key Features of Data Systems that Work • The data are accurate • The data are very easy to collect (1% of staff time)
Key Features of Data Systems that Work • The data are accurate • The data are very easy to collect (1% of staff time) • Data are used for decision-making • The data must be available when decisions need to be made (weekly?) • Difference between data needs at a school building versus data needs for a district • The people who collect the data must see the information used for decision-making
Using Office Discipline Referral Data for On-Going Problem Solving • Use data in decision layers and the“Big Five” • Is there a problem? • Attendance • Faculty Reports • Office Referrals per Day per Month
Using Office Discipline Referral Data for On-Going Problem Solving • Use data in decision layers and the “Big Five” • Is there a problem? • What “system(s)” are problematic? • What individuals (individual units) are problematic? • Don’t drown in the data • It’s “OK” to be doing well • Be efficient
Using Office Discipline Referral Data for On-Going Problem Solving • Is there a problem?
Compare the trends for Total Number of Referrals Per Month with…. Average number of referrals per day per month
Interpreting Office Referral Data:Is there a problem? • Absolute level (depending on size of school) • High Schools (1/95) • Middle Schools (1/109) • Elementary Schools (1/300) • Trends • Peaks before breaks? • Gradual increasing trend across year? • Compare levels to last year • Improvement?
Is There a Problem? Elem. School Office Referrals per Day per Month 2 Maintain - Modify - Terminate 1.5 Ave Referrals per Day 1 0.5 0 Sept Oct Nov Dec Jan Feb Mar Apr May Jun School Months 500 Students
M.S. Office Referrals per Day per Month 20 15 10 Ave Referrals per Day 5 0 Sept Oct Nov Dec Jan Feb Mar Apr May Jun School Months Is There a Problem? Maintain - Modify - Terminate 500 Students
H.S. Office Referrals per Day per Month 20 15 10 Ave Referrals per Day 5 0 Sept Oct Nov Dec Jan Feb Mar Apr May Jun School Months Is There a Problem? Maintain - Modify - Terminate 1000 Students
H.S. Office Referrals per Day per Month 20 15 10 Ave Referrals per Day 5 0 Sept Oct Nov Dec Jan Feb Mar Apr May Jun School Months Is There a Problem? Maintain - Modify - Terminate 2000 Students
2. WHAT SYSTEMS ARE PROBLEMATIC? • Referrals by problem behavior? • What problem behaviors are most common? • Referrals by location? • Are there specific problem locations? • Referrals by time of day? • Are there specific times when problems occur?
Problem Behavior
Frequency of Discipline Referrals By Grade Level (WHO) 140 120 100 80 Number of Referrals 60 40 20 0 6th 7th 8th 9th Discipline Referrals By Grade Level
3. Which students are receiving the referrals? Referrals by Student? Are there many students receiving referrals or only a small number of students with many referrals?