Download
1 / 24
240 likes | 261 Vues
Explore a new 'Bottom-Up' conservation prioritization process for natural lands protection in Southeast PA. Discover how to leverage resources efficiently and speed up the conservation process with the Smart Conservation concept.

E N D
Notice: The views expressed here are those of the individual authors and may not necessarily reflect the views and policies of the United States Environmental Protection Agency (EPA). Scientists in EPA have prepared the EPA sections, and those sections have been reviewed in accordance with EPA’s peer and administrative review policies and approved for presentation and publication. The EPA contributed funding to the construction of this website but is not responsible for it's contents. Mention of trade names or commercial products does not constitute endorsement or recommendation for use.
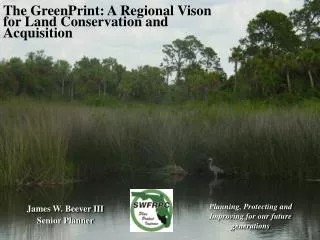
Mission Goal: PROACTIVELY protect the most significant “natural” lands in our region But what are they? And where are they? How can we speed the process up? How can we best leverage our resources?
TM A ‘Bottom-Up’ Scientifically-Valid Process for Setting Conservation Priorities - A Work in Progress
Natural Lands Trust The Nature Conservancy - PA Audubon Society of PA Academy of Natural Sciences of Philadelphia Morris Arboretum Heritage Conservancy Villanova University Delaware River Basin Commission CH2M Hill Drexel University West Chester University Temple University Brandywine Conservancy The University of Pennsylvania Swarthmore College University of the Sciences U.S. EPA Region III Pa. DEP Widener University Philadelphia Zoo DVRPC PEC Society of Conservation Biology Bucks County Open Space Montgomery County Land Trust Conservation Science Forum~ 50++ REGIONAL CONSERVATION ORGANIZATIONS WITH ~ 85+ REPS
SMART CONSERVATION CONCEPT – TIERED APPROACH Community Module Ecological Module Agriculture Module Recreation Scenic Cultural & Historical Module Restoration Module Hydrologic Module Brownfield Module “hot spots” map Step 1 “nomination” site inputs “hot spots” map “hot spots” map “hot spots” map “hot spots” map “hot spots” map Step 2 “PHASE 1” or the WEB TOOL “VOTE” - shows community interest “infers” resource value - using publically available GIS data & establishes relative development “threat” “infers” resource value “infers” resource value “infers” resource value “infers” resource value “infers” resource value Consortium? Step 3 “PHASE 2” Rapid Site Assessment provides database of activities & contacts for coordination “confirms” resource value “confirms” resource value “confirms” resource value “confirms” resource value “confirms” resource value “confirms” resource value Step 4 community profiling (to inform final decisions for the other modules) Review Community Module (votes for nominated sites) Review Community Module (votes for nominated sites) Review Community Module (votes for nominated sites) Review Community Module (votes for nominated sites) Review Community Module (votes for nominated sites) Review Community Module (votes for nominated sites) WHO? Smart Conservation Model User-Tracking NLT PECPHILA & BRANDYWINE PEC PHILA ? Consortium? Consortium ? (NLT guided?) Consortium?
Ranking County Natural Area Inventory & PNDI Polygons This is an early example of the Smart Conservation Ranking system for PNDI/CNAI data by polygon to reveal where the rarest and most viable populations of rare species and communities are found in a geographic region. This ranking takes into account the number of rare elements, their rarity globally and state-wide, as well as the quality of the population and the date the population quality score was assigned Since these early maps were generated with this process in 1998-9, NLT has improved the process so that a numeric 0-10 scoring class system can also be used to make this ranking process compatible with all the other 0-10 score ranking processes in the Smart Conservation project.
Development Threat Assessment for 5-county region in SE PA – could be a model for threat assessment for a broader region if data is available.
View Search Results Select Sites to Compare
Compare Site Values For Searched Sites
Benefits • Establishes approximate relative values for targeting scarce resources • Reveals key resource information, in a consistent way • For resource or site manager, gives site and regional context • Builds regional database assessed sites • Higher Value Protection • Lower Value Restoration • Can work at multiple scales • Future: database of related information? • Species lists • Name of field assessor • Organization undertaking protection activities
Smart Conservation - online atPASDA http://cegis4.cas.psu.edu/scmOverview atwww.smartconservation.org Clare Billett cbillett@natlands.org