Download
1 / 45
470 likes | 1.07k Vues
Scott Lincoln ISU AMS Severe Weather and Radar Workshop November 10 th , 2006. Fundamentals of Radar in Severe Weather Detection. Observing Severe Weather Parameters The Basic Products of Radar Using Radar to Indicate Severe Weather Radar and Ground Truth GR2Analyst Case Studies

E N D
Scott Lincoln ISU AMS Severe Weather and Radar Workshop November 10th, 2006 Fundamentals of Radar in Severe Weather Detection
Observing Severe Weather Parameters The Basic Products of Radar Using Radar to Indicate Severe Weather Radar and Ground Truth GR2Analyst Case Studies Warning Workshop Simulation Outline
Weather Balloons Record and send back information on: Temperature Pressure Dewpoint Location Allows inference of wind direction, wind speed, and height above ground level This information is put together to make a Skew-T Log-P Diagram Observing Severe Weather Parameters
Observing Severe Weather Parameters TEMPERATURE PARAMETERS HODOGRAPH TEMPERATURE / DEWPOINT UNITS DEWPOINT WIND BARBS PRESSURE http://www.rap.ucar.edu/weather/
Skew-T Definitions Lapse Rates: ΔTemp/ΔHeight Dry air cools more quickly than saturated air As saturated air cools, water vapor condenses Condensation is a warming process, therefore causes the saturated air to cool more slowly Parcel Path: Path taken by a parcel of air if it starts at the surface of the earth and is raised upward into the atmosphere. Follows a different lapse rate depending on if it is dry or saturated. Observing Severe Weather Parameters
Skew-T Definitions Lifted Condensation Level (LCL): Dry air from the surface lifted and cools at the dry lapse rate Temperature of the parcel reaches the dewpoint temperature of the parcel Parcel of air now cools at the moist lapse rate This changeover is called the Lifted Condensation Level Is a good indicator of cloud bases of developing storms Lower LFCs are generally more favorable for storms to form Observing Severe Weather Parameters
Skew-T Definitions Level of Free Convection (LFC): Hot air is more buoyant than surrounding cooler air In most cases lifted air parcels from the ground cool off to temperatures below that of the environment at mid and upper levels (Stable Airmass) If surface temperatures and dewpoints are high enough to allow the lifted parcel to become warmer than the environment at mid and upper levels, the parcel can become buoyant and continue upward without forcing The point at which no forcing becomes necessary for the parcel to accelerate upward is called the Level of Free Convection Lower LFCs are generally more favorable for storms to form Observing Severe Weather Parameters
Observing Severe Weather Parameters SATURATED LAPSERATE – CURVED GREEN LINES DRY LAPSERATE – STRAIGHT RED LINES PARCELPATH THIS IS A STABLE AIRMASS -No LFC LCL http://www.rap.ucar.edu/weather/
Skew-T Definitions Convective Available Potential Energy (CAPE): Sum of the amount of energy available to storms based on how much warmer the parcel path is compared to the environmental temperature Higher CAPE generally means higher chance of severe weather Inversion: When the environmental temperature increases with height On a Skew-T this would be the environmental temperature generally turned to the right at more than a 45° angle Inversions can block rising air, but can be overcome by incoming weather disturbances An inversion becomes a cap when it inhibits convection Observing Severe Weather Parameters
Observing Severe Weather Parameters PARCELPATH VERY UNSTABLE AIRMASS CAPE 0° LINE (Black) Frzg Level INVERSION LFC LCL
Skew-T Definitions Speed Shear: Speed shear is change in wind speed with height Good speed shear – generally means increasing wind speed as a parcel rises from the surface to the mid-levels Directional Shear: Directional shear is change in wind direction with height Good directional shear – change of about 90° of direction from the surface to the mid-levels Surface winds out of the south or south-southeast under mid-level winds out of the wind are generally considered ideal directional shear conditions Observing Severe Weather Parameters
Observing Severe Weather Parameters WSW @ 45 knots Wind direction change of about 50° - 70° Wind speed change of about 25-30 knots S to SSW @ 15-20 knots
Severe Weather Parameters Summary More Favorable for Severe Weather: More CAPE More directional shear More speed shear Lower LCLs Lower LFCs Higher Dewpoint Observing Severe Weather Parameters
The Basic Products of Radar • Volumetric Radar Display - Today • Simple Radar Display – 1960
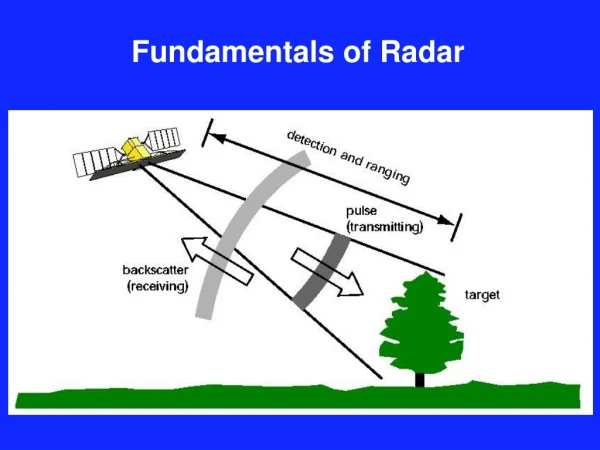
How Radar Works When hit by electromagnetic radiation, objects re-emit it in all directions The Basic Products of Radar • Distance from the radar site is determined by time taken for the • re-emitted wave to reach the dish • More energy sent back from a particular area generally • means heavier rain or hail
How Radar Works Moving objects change the frequency of re-emitted waves depending on movement towards or away from the radar The Basic Products of Radar • Higher frequencies correspond to towards, lower frequencies correspond to away
The Basic Products of Radar • Base Reflectivity • Assigns a value in DBZ to a particular area based on how much energy is • re-emitted to the radar unit from that point.
The Basic Products of Radar • Base Velocity • Assigns a wind speed and the direction of toward/awa to a particular area. • Uses the doppler effect to determine direction towards or away from the radar • unit, as well as the speed in knots.
The Basic Products of Radar • Vertically Integrated Liquid (VIL) • Estimates the mass of water above an area the size of a square meter on the ground
The Basic Products of Radar • Vertically Integrated Liquid Density (VILD) • Turns VIL into a density by dividing VIL by the height of a storm. • Estimates chance of heavy rain and hail better than VIL. • Short storms with the same VIL as a taller storm generally contain larger hail.
The Basic Products of Radar • Hail Algorithms • Probability of Severe Hail (POSH): • An algorithm that uses the mass of a storm above the freezing level and determines the likelihood that such a storm would produce hail larger than 0.75” in diameter. • Maximum Estimated Hail Size (MEHS): • An algorithm that uses the mass of a storm above the freezing level and determines the size of the largest hail stones expected under those conditions. What is shown on the radar display represents the size of the hail core aloft, generally takes 2-3 radar scans for that hail to reach the ground
The Basic Products of Radar • Storm Relative Motion Velocity • Removes the direction and speed of storms from the velocity image. • Makes it easier to to see areas of rotation.
The Basic Products of Radar • Spectrum Width • Displays a variance in the values of velocity for a given area. • Can emphasize areas of sharp changes in wind direction and speed, as well as • small areas of rotation under certain conditions.
Volume Coverage Pattern (VCP) Each NEXRAD unit can be switched to different scanning patterns that scan the sky at different speeds and with varying elevation angles. Two Basic Types: Clear Air Mode Precipitation Mode The Basic Products of Radar
Volume Coverage Pattern (VCP) Clear Air Mode VCP 31 and VCP 32 Used for periods when no major precipitation is occuring, such as light snow or very light rain 12 minutes to complete a volume scan of the atmosphere The most sensitive to precipitation and other things The Basic Products of Radar VCP 31&32
Volume Coverage Pattern (VCP) Precipitation Mode VCP 11, VCP 12, VCP 21, and VCP 121 Used for periods when heavier precipitation is occuring Fastest volume scan takes 4 minutes 6 seconds, longest takes 6 minutes The Basic Products of Radar VCP 11&12 VCP 21&121
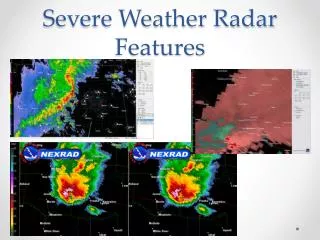
Using Radar to Indicate Severe Weather • MEHS Display in GR2Analyst
Using Radar to Indicate Severe Weather Weak Echo Region Areas of reflectivity suspended above areas of lower or absent reflectivity Representative of the location of the storm updraft Good indication of a strong/severe storm WER
Using Radar to Indicate Severe Weather Bounded Weak Echo Region (BWER) Weak echo region that is surrounded on all sides by higher reflectivity Like a “cave” in the storm due to a very strong updraft Good indication of a severe storm and is a supercell characteristic BWERs can be found by taking two cross-sectional storm slices or by using a volumetric radar display. WER
Using Radar to Indicate Severe Weather Hook Echo Rotation in the weak echo region pulls a lower reflectivity area into the storm and a higher reflectivity area out of the storm A fairly typical indication of a supercell storm Velocity Couplet Two radar pixels of strong winds in opposing directions side by side An indication of strong rotation and possible tornado formation if conditions are favorable
Using Radar to Indicate Severe Weather Hidden Rotation Signatures Not always an obvious hook echo, but velocity image shows rotation May develop quickly, or may not appear to be a hook that is not associated with tornadic rotation
Using Radar to Indicate Severe Weather Bow Echo Indication on radar of strong/severe straight line winds Strong downdraft occurs that begins pushing part of a storm or line of storms ahead of other storms, resembles a bow
Using Radar to Indicate Severe Weather Hail Spike (TBSS) Indication on radar of severe hail Large hail in a storm reflects the radar beam into the ground, some of that energy is reflected right back to the hail and then back to the radar unit The energy reflected back to the radar unit usually shows up where no precipitation is actually occurring Shows up often in tilts above the lowest tilt of the volume scan
Using Radar to Indicate Severe Weather Outflow Boundary Indication of a change air density and temperature from a storms rain-cooled downdraft Outflow boundaries can cut off the inflow to another storm, causing it to weaken Outflow boundaries can trigger more convection Outflow boundaries can sometimes affect tornado formation
Using Radar to Indicate Severe Weather Outflow Boundary Boundary can indicate location of strong winds in a storm outflow or along a gust front Act similarly to a cold front, lifting air in front and causing precipitation to fall along and behind the boundary
Radar and Ground Truth • Woodward, IA Tornado • The chaser and radar perspectives
Radar and Ground Truth Classic Supercell Core of hail and heaviest rain in front of the rotation The most common type of supercell thunderstorm • Simon Bishop, 2001
Radar and Ground Truth High Precipitation Supercell (HP) Core of hail and heaviest rain behind and wrapping around the rotation Tornadoes from HP Supercells are very difficult to see • Greg Stumpf, 1997
Radar and Ground Truth Low Precipitation Supercell (LP) Usually a lack of hail and heavy rain in the thunderstorm cell, but is a supercell because of rotating updraft Usually form in areas of dry low levels and low CAPE values
Radar and Ground Truth Rear Flank Downdraft (RFD) Area of downward motion behind the main updraft that makes up the hook echo RFDs rotate around the updraft and can contain very strong winds
Radar and Ground Truth Tornado Formation Wall cloud forms because of the reduction in pressure and cooling air beneath the rising the air of the updraft Wall clouds begin to rotate when rotation increases at the low levels • Mike Hollingshead
Radar and Ground Truth Tornado Formation Within as little as one radar scan, quickly increasing rotation near the ground can produce a funnel cloud or a tornado • Mike Hollingshead
Radar and Ground Truth Tornado Formation The chaser observing this tornado is not in an ideal location. He is situated in the hail core looking to the southwest. The tail cloud points from the updraft/tornado to the rain shaft • Mike Hollingshead
Radar and Ground Truth Non-Supercell Tornadoes Often called landspouts, these are officially considered tornadoes but cause far less damage They must be connected to the cloud base but are not generally associated with large scale rotation in a thunderstorm • www.ontariostorms.com
Goal Learn how to use GR2Analyst by: Setting up a live polling source Personalizing the GIS Settings Examining cases of severe weather GR2Analyst Edition