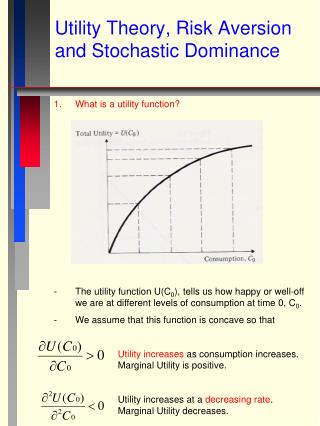
Stochastic Dominance and Program Evaluation: Assessing Child Nutrition in Kenya
This paper introduces a Stochastic Dominance (SD) approach to program evaluation, merging it with Differences-in-Differences (DD) method. Applying it to child nutrition changes in Kenya, the study analyzes a large dataset to assess the impact of a welfare program. The methodology extends SD to dynamic contexts and presents empirical results focusing on child malnutrition in arid regions. The research aims to go beyond average treatment effects, offering a comprehensive evaluation of distributional impacts. By comparing entire distributions, the study provides insights into the effectiveness of the program, shedding light on welfare changes over time.

Stochastic Dominance and Program Evaluation: Assessing Child Nutrition in Kenya
E N D
Presentation Transcript
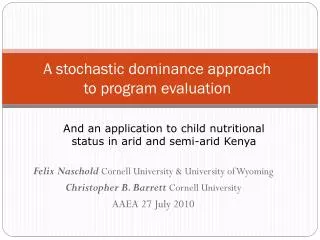
A stochastic dominance approach to program evaluation Felix NascholdCornell University & University of Wyoming Christopher B. BarrettCornell University AAEA 27 July 2010 And an application to child nutritional status in arid and semi-arid Kenya
Motivation • Program Evaluation Methods • By design they focus on mean. Ex: “average treatment effect” • In practice often interested in distributional impact • Limited possibility for doing this by splitting sample • Stochastic dominance • By design look at entire distribution • Now commonly used in snapshot welfare comparisons • But not for program evaluation. Ex: “differences-in-differences” • This paper merges the two Diff-in-Diff (DD) evaluation using stochastic dominance (SD)
Main Contributions of this paper • Proposes DD-based SD method for program evaluation • First application to evaluating welfare changes over time • Specific application to new dataset on changes in child nutrition in arid and semi-arid lands (ASAL) of Kenya • Unique, large dataset of 600,000+ observations collected by the Arid Lands Resource Management Project (ALRMP II) • (one of) first to use Z-scores of Mid-upper arm circumference (MUAC)
Main Results • Methodology • (relatively) straight-forward extension of SD to dynamic context: static SD results carry over • Interpretation differs (as based on cdfs) • Only up to second order SD • Empirical results • Child malnutrition in Kenyan ASALs remains dire • No average treatment effect of ALRMP expenditures • Differential impact with fewer negative changes in treatment sublocations • ALRMP a nutritional safety net?
Program evaluation (PE) methods • Fundamental problem of PE: want to but cannot observe a person’s outcomes in treatment and control state • Solution 1: make treatment and control look the same (randomization) • Gives average treatment effect • Solution 2: compare changes across treatment and control (Difference-in-Difference) • Gives average treatment effect:
New PE method based on SD • Objective: to look beyond the ‘average treatment effect’ • Approach: SD compares entire distributions not just their summary statistics • Two advantages • Circumvents (highly controversial) cut-off point. Examples: poverty line, MUAC Z-score cut-off • Unifies analysis for broad classes of welfare indicators
Cumulative % of population FB(x) FA(x) xmax 0 MUAC Z-score Definition of Stochastic Dominance First order: A FOD B up toiff Sth order: A sth order dominates B iff
SD and single differences • These SD dominance criteria • Apply directly to single difference evaluation (across time OR across treatment and control groups) • Do not directly apply to DD • Literature to date: • Single paper: Verme (2010) on single differences • SD entirely absent from PE literature (e.g. Handbook of Development Economics)
Expanding SD to DD estimation - Method Practical importance: evaluate beyond-mean effect in non-experimental data Let , G denote the set of probability density functions of Δ. and The respective cdfsof changes are GA(Δ) and GB(Δ) Then A FOD B iff A Sth order dominates B iff
Expanding SD to DD estimation –2 differences in interpretation 1. Cut-off point in terms of changes not levels. Cdf orders changes from most negative to most positive ‘poverty blind’ or ‘malnutrition blind’. (Partial) remedy: run on subset of ever-poor/always-poor 2. Interpretation of dominance orders FOD: differences in distributions of changes between intervention and control sublocations SOD: degree of concentration of these changes at lower end of distributions TOD: additional weight to lower end of distribution. Sense in doing this for welfare changes irrespective of absolute welfare?
Setting and data • Arid and Semi-arid district in Kenya • Characterized by pastoralism • Highest poverty incidences in Kenya, high infant mortality and malnutrition levels above emergency thresholds • Data • From Arid Lands Resource Management Project Phase II • 28 districts, 128 sublocations, June 05- Aug 09, 600,000 obs. • Welfare Indicator: MUAC Z-scores • Severe amount of malnutrition: • 10 percent of children have Z-scores below -1.54 and -2.55 • 25 percent of children have Z-scores below -1.15 and -2.06
The pseudo panel used • Sublocation-specific pseudo panel 2005/06-2008/09 • Why pseudo-panel? • Inconsistent child identifiers • MUAC data not available for all children in all months • Graduation out of and birth into the sample • How? • 14 summary statistics – mean & percentiles and ‘poverty measures’ • Focus on malnourished children • Thus, present analysis median MUAC Z-score of children below 0 • Control and intervention according to project investment
Results: DD Regression Pseudo panel regression model No statistically significant average program impact
Results – DD regression panel Robust p-values in parentheses *** p<0.01, ** p<0.05, * p<0.1 District dummy variables included.
Stochastic Dominance Results Three steps: • Steps 1 & 2: Simple differences • SD within control and treatment over time: no difference in trends. Both improved slightly • SD control vs. treatment at beginning and at end: control sublocations dominate in most cases, intervention never • Step 3: SD on DD (results focus for today)
Conclusions • Existing program evaluation approaches average treatment effect • This paper: new SD-based method to evaluate impact across entire distribution for non-experimental data • Results show practical importance of looking beyond averages • Standard DD regressions: no impact at the mean • SD DD: intervention sublocations had fewer negative observations • ALRMP II may have functioned as nutritional safety net (though only correlation, no way to get at causality)
Expanding SD to DD estimation –controlling for covariates • In regression DD: simply add (linear) controls • In SD-DD need a two step method • Regress outcome variable on covariates • Use residuals (the unexplained variation) in SD DD • In application below first stage controls for drought (NDVI)
SD, poverty & social welfare orderings (1) 1. SD and Poverty orderings • Let SDs denote stochastic dominance of order s and Pα stand for poverty ordering (‘has less poverty’) • Let α=s-1 • Then A Pα B iff A SDs B • SD and Poverty orderings are nested • A SD1 B A SD2 B A SD3B • A P1 B A P2 B A P3 B
SD, poverty & social welfare orderings (2) 2. Poverty and Welfare orderings (Foster and Shorrocks 1988) • Let U(F) be the class of symmetric utilitarian welfare functions • Then A Pα B iff A Uα B • Examples: • U1 represents the monotonic utilitarian welfare functions such that u’>0. Less malnutrition is better, regardless for whom. • U2 represents equality preference welfare functions such that u’’<0. A mean preserving progressive transfer increases U2. • U3 represents transfer sensitive social welfare functions such that u’’’>0. A transfer is valued more lower in the distribution • Bottomline: For welfare levels tests up to third order make sense
DD Regression 2 Individual MUAC Z-score regression To test program impact with much larger data set Still no statistically significant average program impact
Results – DD regression indiv data Robust p-values in parentheses *** p<0.01, ** p<0.05, * p<0.1 District dummy variables included.