Download
1 / 75
880 likes | 1.39k Vues
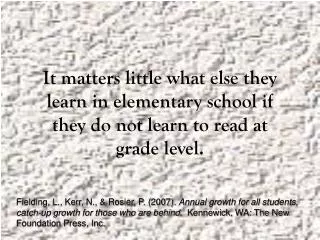
It matters little what else they learn in elementary school if they do not learn to read at grade level. Fielding, L., Kerr, N., & Rosier, P. (2007). Annual growth for all students, catch-up growth for those who are behind . Kennewick, WA: The New Foundation Press, Inc.

E N D
It matters little what else they learn in elementary school if they do not learn to read at grade level. Fielding, L., Kerr, N., & Rosier, P. (2007). Annual growth for all students, catch-up growth for those who are behind. Kennewick, WA: The New Foundation Press, Inc.
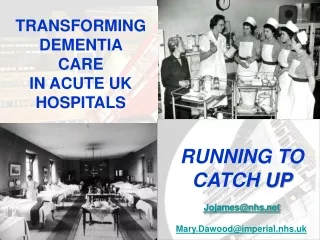
Annual Growth, Catch Up Growth Traverse Bay Area Intermediate School District Regional Staff Development Day November 2, 2009 Jim Linsell
Kennewick School District • 54, 000 population • 13 elementary schools • 4 middle schools • 3 high schools • 2007 Student enrollment: 15087 • District Free/Reduced Rate: 27%
We’ve all responded in some way– emotionally, professionally or intellectually – to the ESEA (NCLB) goal of 100% proficiency by 2014. Have these responses supported student growth? Have they hindered student growth? How?
What are your theories - why do some young readers fail to read well?
To Put AGCG Principles Into Action… • changes in beliefs • changes in teaching practice • changes in instructional leadership moves • needed district roles • possible obstacles
The Effects of Weaknesses in Oral Language on Reading Growth (Hirsch, 1996) 16 15 14 13 12 11 10 9 8 7 6 5 High Oral Language in Kindergarten 5.2 years difference Reading Age Level Low Oral Language in Kindergarten 5 6 7 8 9 10 11 12 13 14 15 16 Chronological Age
Growth in “phonics” ability of children who begin first grade in the bottom 20% in Phoneme Awareness and Letter Knowledge (Torgesen & Mathes, 2000) Low Average Reading Grade Level Grade level corresponding to age
Growth in word reading ability of children who begin first grade in the bottom 20% in Phoneme Awareness and Letter Knowledge (Torgesen & Mathes, 2000) Low Average Reading grade level 1 2 3 4 5 Grade level corresponding to age
Growth in reading comprehension of children who begin first grade in the bottom 20% in Phoneme Awareness and Letter Knowledge (Torgesen & Mathes, 2000) Low Average Reading Grade Level Same verbal ability – very different Reading Comprehension Grade level corresponding to age
The achievement gap in reading is created before the first day of kindergarten.
By age five 20% have made only three years of language growth. Another 20 % have made only four years growth. Other children make five to eight years of growth. • On the first day of kindergarten any given class may show a range of six years of language growth.
What Are Sources and Kinds of Diversity That Explain This Six Year Range of Language Growth?
Two Important Sources of Diversity 1. Diversity in talent or inherent abilities for learning. Learning disabilities Low general intelligence 2. Diversity in pre-school preparation and family supports for learning to read. Poverty Language status
Three Important Kinds of Diversity 1. Diversity of broad verbal and cognitive abilities required for the comprehension of language 2. Diversity in the specific verbal/linguistic abilities required for learning to read printed words accurately and fluently 3. Diversity in the motivational/behavioral attitudes and habits required for learning in school
Catch-up Growth is rarely achieved by pressuring students who are behind to “run faster” in the same amount of time.
Catch-up growth is typically achieved by dramatically increasing direct instructional time and using it wisely.
Direct instruction…is an instructional approach that utilizes explicit and structured teaching routines. A teacher using direct instruction models, explains, and guides the students through extended practice of a skill or concept until mastery is achieved. The lessons are fast paced, students are academically engaged, and teachers are enthusiastically delivering instruction. Direct instruction is appropriate instruction for all learners, all five components of reading, and in all settings (whole group, small group, and one-on-one). FLORIDA CENTER FOR READING RESEARCH
Predictors of Reading Achievement: • Most Powerful Predictor - Quantity of Direct Instructional Time • #2 Predictor - Instructor Factors • #3 Predictor - Socio-economic Factors
Five Components of Reading • Phonemic awareness • Decoding • Fluency • Vocabulary • Comprehension
Targeted Accelerated Growth The TAG Loop 1. Diagnostic Testing 2. Proportional increases in direct instructional time 3. Teaching to the deficient sub-skill 4. Retesting to be sure the skill has been learned
A First Step Using Data… • Rank every student in order of ability. • Draw a line of demarcation. • Students below the line get additional services.
Data do not use themselves and may sit unused in a perfectly good assessment system in a data-indifferent or a data-hostile school culture.
Where would you rate your colleagues’ attitudes about data? Love Our Data: it tells us how we’re doing with each child and informs our day-to-day instructional decisions. We can’t wait to see the next set of scores! We’re data-hostile! Leave me alone and just let me teach. I know how my students are progressing by watching them in class. We’re data indifferent.Take or leave it. It’s no big deal whether we look at data or not.
What is Benchmarking? • All students are assessed at their grade level using the same materials • Shows the range of students’ abilities • Shows the growth necessary for students to reach grade level benchmarks • Indicates the effectiveness of the core curriculum and/or instruction
What is Progress Monitoring? • Progress monitoring is when teachers assess students’ academic performance on a regular basis (daily, weekly, monthly, etc.) for two purposes: • To determine whether children are profiting appropriately from the typical instructional program • To build more effective programs for children who benefit inadequately from typical instruction. • Lynn and Douglas Fuchs, Vanderbilt University
Schoolwide Assessment Model • Benchmark: all students are assessed 3x per year using grade level materials (September, January, May) • Progress Monitoring/Strategic Monitoring: at-risk students are monitored on a more frequent basis to track rate of improvement and determine instructional impact (set goals, chart progress)
Oral Reading Fluency • Over 25 years of research has produced evidence of its utility as a valid progress monitoring tool. • One predictor of comprehension • One minute probes with consistent levels of difficulty • Scored as words read correct per minute (errors are counted as well)
What non-numerical data is worth gathering and acting upon as we help children to learn to read?
What roles can building and district leaders play to create systemic change that allows all students to read at or above grade-level?
Building and District Roles • Articulate the vision. Set the benchmarks. • Provide adequate diagnostic assessment tools. • Provide teaching materials • Provide training: teachers and principals • Monitor implementation: learning walks • Support, support, support
The Chicken or the Egg Beliefs Behaviors Or... Behaviors Beliefs
If behaviors change before beliefs,…what behaviors must we begin doing that we are not yet doing?
What beliefs do you think need to change in order for students to experience both annual growth and catch-up growth? 2. Do you share the belief that reading is more important than any other area in the curriculum? Why or why not?