Download
1 / 14
140 likes | 259 Vues
This report presents a detailed analysis of early education trends, focusing on the P-16 system and how children engage in early learning. It outlines enrollment statistics, funding increases, and the evolution of the early education landscape, emphasizing the importance of high-quality programs. The study highlights effective instructional strategies, the necessity of qualified teachers, and supports for diverse learners, especially in areas with significant poverty. It calls for enhanced accessibility to well-rounded early education, incorporating parental involvement and preparing children for future academic success.

E N D
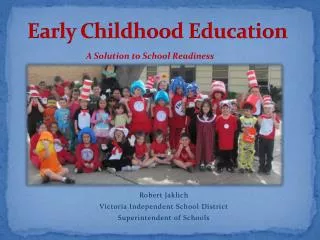
RESHAPING EARLY EDUCATION A P-16 SYSTEM
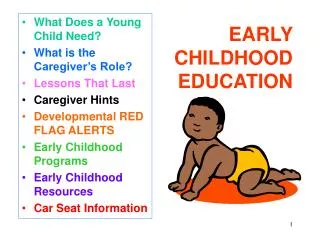
What Does Early Educationlook like? • 240,0004 year olds • 225,045 children in kindergarten • 93,000 children in prekindergarten • 396 / 698 LEAs implementing UPK • 60% of UPK sites are in CBOs • 603 / 678 offer full day kindergarten only • 34 / 678 offer half day kindergarten only
80% of 4 year olds are in placements outside the home prior to kindergarten • 63% of women worked outside the home in 1998 as compared to 44% in 1950 • 36% of Black American children live in poverty • 26% of Hispanic children live in poverty • In NYC, 42% of children are in homes where more than 1 language is spoken
ELLs by predominate (NYC) language groups, 2005-06Source: BESIS (ATS), 2005-2006
What has been happening? • Convergence of Research • Perry Preschool • Chicago Parent Child Center • Abecedarian • Clive Belfield • Steve Barnett • NCEDC PreK Study • Reading First Data • Increased Funding • 1998-99 $67.4 million • 2007-208 $437.9 million • Increased Legislation • NCLB • Ready First • Chapter 57 • Head Start • Leadership/Political Will • Governor’s Educational Initiative • Children's Cabinet • Preschool Special Education Task Force
How Pre-K children spendtheir time Other Meals Whole Group Routine Small Group Free Choice/Center
Child Engagement Literacy Math None of These Science Writing Social Studies Art/Music Motor
Teacher-child interaction Elaborated Minimal Routine None
Comparison of Mean Proficiency Rates on ORF in Cohort A Schools by Grade
Comparison of mean proficiency rates on comprehension in cohort a schools by grade
Comparison of mean proficiency rates on vocabulary in cohort a schools by grade
What does an excellent early childhood program look like? • A well balanced instructional program based on research: Multi-State study by National Center for Early Development and Learning • 2.47 / 7.00 – Instructional Climate (ECER) • 5.27 / 7.00 – Emotional Climate • Intentional Instruction • Research-based Curriculum • Excellent Instructional Programs • Dedicated Block of Time for Reading • Systematic Evaluation/Progress Monitoring • Use of Data • Responsive Intervention • Alignment between PreK – K – 1
What infracture is needed? • Highly qualified teacher • Extensive professional development • Small teacher/child ratios • Parental involvement • Leadership • Knowledge of research
Where Do we go from here? • Accessibility of high quality programs in any setting or geographic region • Parental voice • 21st Century skills • Revised Pre-k standards • Lower compulsory age • Full day kindergarten requirement