Download
1 / 21
210 likes | 339 Vues
This presentation delves into the comprehensive design, production, assembly, readout, installation, and commissioning of the DØ Silicon Microstrip Tracker (SMT). Key elements include the specifications for 12 disks and a 4-layer barrel, focusing on achieving superior track reconstruction for both high-pT and low-pT tracks. The document highlights the intricate challenges faced during manufacturing, testing methods employed for quality assurance, and the initial results from the commissioning phase, underlining the performance metrics essential for precise particle detection and analysis.

E N D
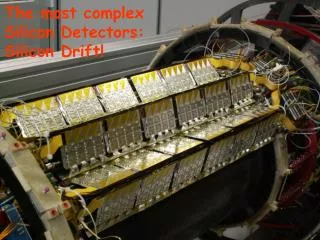
The DØ Silicon Microstrip Tracker (SMT) • Design • Production & Assembly • Readout • Installation & Commissioning • First Results Breese Quinn, FNAL Vertex2001 September 24, 2001 (presented by Frank Lehner, Universitaet Zuerich)
SMT Design 12 F Disks 4-layer barrel cross-section 4 H Disks 6 Barrels SMT Statistics B. Quinn
SMT Design B. Quinn
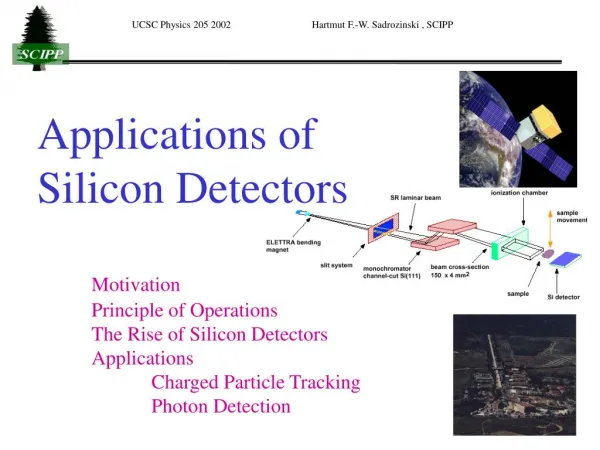
SMT Design • Require good 3D track reconstruction performance for high-pT (top, Higgs, EW, NP) and low-pT (B) tracks out to || < 3 • Momentum resolution less than 10% at pT = 1 GeV/c • Impact parameter resolution within 30 m • Forward H disks are employed to achieve these resolutions at high || B. Quinn
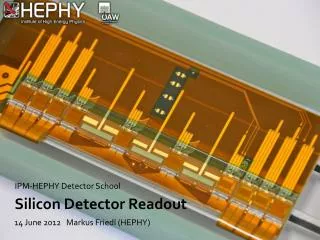
Production & Assembly: Devices • Ladders • 3-chip: 72 single-sided, axial ladders in the two outer barrels • 6-chip: 144 double-sided, axial/90° ladders in the four inner barrels • 9-chip: 216 double-sided, axial/2° ladders in all barrels • Ladders have a mechanical accuracy of 2-5 m • Wedges • F Disks: 144 double-sided, ±15°, 6+8 chip wedges • H Disks: 96×2 back-to-back single-sided, ±7.5°, 6 chip wedges • Wedges have a mechanical accuracy of 5-10 m • SVX IIe chip • 128 channel 8-bit digital chip, with 32 cell pipeline depth • 1.2 m rad-hard technology • 106 MHz digitization, 53 MHz readout • Rise time set to integrate 99% of charge in 100 ns • Over 2.3 million wirebonds were made to chips 9-chip ladder H wedge SVX IIe chip B. Quinn
Production & Assembly: Testing • Probe Test • Debug bad strips (broken capacitors), bonds, chips, etc. • Determine the V-I characteristics of the sensors • Measure V-max p-side breakdown voltage (micro-discharge effect) • Burn-in • Bias the ladder or wedge and test the readout for 72 hours • Measure pedestals, noise, gain and check sparse readout • Laser • Expose biased detectors to a narrow laser scan • Measure the depletion voltage and leakage currents and identify dead channels • Readout tested again after the detector is mounted on a barrel or disk V-max Fail B. Quinn
Production & Assembly: Failure Modes • Sensor lithography defects • A silicon manufacturing problem produced p-stop isolation defects in the 90° stereo ladders. This resulted in a 30% yield from the manufacturer. • Microdischarge effect • With negative p-side bias on double-sided detectors, we observed microdischarges producing large leakage currents and noise at a breakdown voltage. • The effect occurs along the edges of the p implants, where large field distortions and charge accumulations result from misalignment of electrodes with implants. • Effect moves to n-side after type inversion. B. Quinn
Production & Assembly: Detector Quality • Detector classification: • Dead channel: < 40 ADC count response to laser • Noisy channel: > 6 ADC count pedestal width • Grade A: less than 2.6% dead/noisy channels • Grade B: less than 5.2% dead/noisy channels • Only used mechanically OK Grade A and B detectors 6-Chip Ladders Channel Fractions (%) B. Quinn
Production & Assembly: Alignment Barrel 1 Rotations Internal alignment was accomplished using a CMM machine that aligns ladders and wedges to < 20 m. e.g. Rotation along long axis of ladder ( = 10 m 3 m error on impact parameter) (mm) B. Quinn
SMT Readout: Data Flow HV / LV I,V,T Monitoring 8’ Low Mass Cable ~19’-30’ High Mass Cable (3M/80 conductor) 25’ High Mass Cable (3M/50 conductor) 3/6/8/9 Chip HDI KSU Interface Board CLKs CLKs Adapter Card SEQ SEQ SEQ Sensor SEQ Controller Optical Link 1Gb/s Detector volume Platform Serial Command Link VRB VRB VRB VBD 68k/PwrPC 1 5 5 3 VRB Controller Bit3 VME PC MPM L3 Counting House SDAQ B. Quinn
SMT Readout: Electronics • SEQuencers • 6 crates (120 boards) located on the detector hall platform • Use SVX control lines to effect data acquisition, digitization and readout • Convert SVX data to optical signals • VRBs (VME Readout Buffers) • 12 crates (120 boards) located in the counting house • Data buffer pending L2 trigger decision • Input @ 5-10 kHz L1 accept rate ~ 50 Mb/s/channel • Output @ 1 kHz L2 accept rate ~ 50 Mb/s • Interface Boards • 8 crates (144 boards) located inside the detector volume • Refresh signals and adjust timing • SVX monitoring and power management • Bias voltage distribution B. Quinn
Installation Fiber Tracker • Cylinder installation was completed on 12/20/00 • A ½ cylinder of 3 barrels and 6 F disks was inserted into each end of the CFT bore • H Disk installation was completed on 2/6/01 • The cabling (~15,000 connections) and electronics installation was completed in May 2001 Calorimeter Low Mass Cables SMT High Mass Cables Interface Boards B. Quinn
Commissioning • The entire detector has been connected and powered • ~15% of the devices are not in the readout because the SVX chips cannot be downloaded. • 10% ladders, 18% F wedges, 20% H wedges • Problems could be with cables, connectors, chips, etc. We will debug each of them during the October/November shutdown, and expect to recover more than half. • Currently collecting calibration and alignment data B. Quinn
Comissioning • Online event display for SMT commissioning B. Quinn
Charge Collection • A cluster is defined as a contiguous sequence of strips with • Each strip 6 ADC counts • Cluster 12 ADC counts • Timing setting a-b-c represents a signal delay of (a-1)132 ns + (b-1)18 ns + (c-1)2 ns • Preamp bandwith (pabw) sets the integration time • With 396 ns bunch spacing, all charge should be collected with any of the pabw settings • Higher pabw results in lower noise level B. Quinn
Timing and S/N • Higher preamp bandwith does not significantly reduce noise on n-side B. Quinn
Alignment: Residuals • SMT-only tracking with at least 4 hits • Magnet off data • Similarity of residuals from reconstruction with ideal and survey geometries indicates excellent internal alignment of the SMT Ideal Geometry Survey Geometry B. Quinn
Alignment: SMT & CFT Track Matching • Tracks were found separately in the SMT and the Central Fiber Tracker (CFT) • SMT tracks were extrapolated to the CFT at which point the track offsets were measured • Magnet off data r = -3 36 m B. Quinn
J/ Candidate Sample PRELIMINARY Sherry Towers B. Quinn
Conclusions • Design/Production • Experience with double-sided detectors has led to the decision to use single-sided silicon for the upgrade. • Should work toward simpler designs in the future. For example, using 6 different sensor types resulted in extensive logistical complications. • Assembly/Installation • Alignment results show that the DØ SMT was assembled and installed extremely well. Congratulations to the SiDet and DAB staff! • Commissioning • The SMT was the first major DØ Upgrade detector system fully operational for Run 2A. More than 85% of the channels were available for readout on startup, and most of the remaining channels will be debugged and recovered by November. • Results • Very nice calibration (and first look at physics!) results have been produced from the early data, as we continue to better understand our detector. B. Quinn
Alignment: Beam Distance of Closest Approach vs. Vertex Position B. Quinn