Download
1 / 44
440 likes | 556 Vues
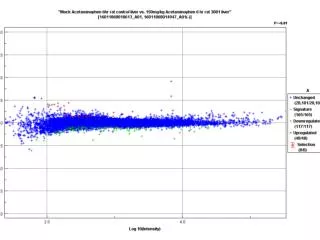
LogRatio and logIntensity plots are essential tools in data analysis, particularly in fields like genomics and bioinformatics. They provide a visual representation of the relationships between two variables by transforming them onto a logarithmic scale. LogRatio expresses the relative change between conditions, while logIntensity reflects the overall signal intensity. These plots allow researchers to identify patterns, outliers, and correlations within complex datasets, facilitating deeper insights into biological processes and experimental results.

E N D