Enhancing Stream Gage Networks: A Collaborative Approach to Water Resource Management
The CBRFC Stakeholder Forum held on July 31, 2012, discussed the importance of stream gage networks involving various agencies like USGS, Colorado Division of Water Rights, and state engineers. Key topics included data collection processes, flow rating curves, and real-time data acquisition systems essential for accurate hydrometeorological modeling. The forum highlighted challenges such as missing data, equipment issues, and the need for quality control in stream flow data to improve forecast accuracy. Collaborative efforts among stakeholders aim for enhanced operational efficiency and data reliability.

Enhancing Stream Gage Networks: A Collaborative Approach to Water Resource Management
E N D
Presentation Transcript
Stream Gages CBRFC Stakeholder Forum July 31, 2012
Stream Gage Networks • USGS • Colorado Division of Water Rights • Wyoming State Engineer Office • Salt Lake County • Salt Lake City • ALERT sites (Arizona and Nevada) • Salt River Project • Pacifcorp • Bureau of Reclamation • Army Corps of Engineers • Water Conservancy Districts/Water Users (CUWCD, EWCD, NCWCD, CRWCD, Bear River, Green River, Sevier)
All available stream gages Stream gages used in model ~875 points
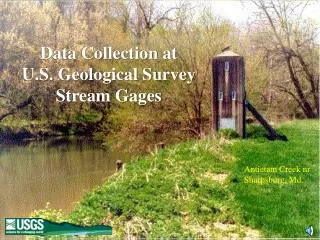
Data Collection • Hydrometeorological Automated Data System (HADS) • NWS real-time data acquisition and data distribution system • GOES DCP • USGS data corrections • Websites/Web Service • Email • FTP Site • Collect: • STAGE RATING CURVE FLOW MODEL • FLOW MODEL
Rating Curves • Every day • Check our current stage/flow relationship against the USGS current conditions listing • If our flow is more than 5% different than USGS flow we download the latest available pre-shifted rating from the USGS Rating Depot • 2x week • Download all ratings from the USGS Rating Depot. • Download all ratings/shifts from the Colorado Division of Water Resources. • Occasionally (not often) • Download ratings for Arizona ALERT and WYSEO • Hard to find, not easy to automate download. • Updated infrequently • All new ratings are stored to the CBRFC database and copied to CHPS for use in our daily model.
Stage Flow (cfs)
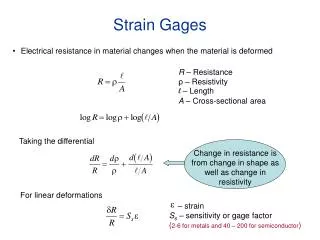
Rating Curve Extension • Stored rating tables are extended to all critical stages (bank, flood, moderate, and major) • Any of these values that are above the base rating obtained from the owner agency have a flow value calculated for them using a log10 extension of the rating. • On-the-fly extensions for real-time stage values above the stored table also use a log10 extension • May get extension from USGS in flood events
Major Flood Major Flood Extension graphic example Flood Bankfull
Stream Gage Issues OTHER • Bad Data • Missing Data • Ice/Frozen • - Majority of gaging network set bad in winter • Equipment Issues • Flood Damage • Water Balance • Upstream -> Downstream RATING CURVES • No Rating • Outdated rating/shift • May be updated only once per water year • Rapidly changing conditions • Observation above or below rating • Uncertainty in measurements/shifts/ratings • Timing issues getting rating updates • No way to “correct” data in the past
Not corrected in past Corrected in past
ICE Missing Data Bad Data Equipment • Data must be quality controlled for accurate forecasts….often a tough decision.
Flood Damage-Virgin River 2010 End of the event only ~6/14 gages were still working. More gages=more information=better forecasts
Water Balance Issue Glenwood Springs Cameo Palisade
GlenwoodSprings Cameo Which gage is wrong? Model consumptive use Simulation Simulation Simulation Forecast Forecast Forecast Observation Observation Observation Palisade
GlenwoodSprings Cameo Ignored Cameo gage Model consumptive use Simulation Simulation Simulation Observation Observation Forecast Forecast Forecast Observation Better balance Palisade
Summary • -Stream flow is a direct input into the model • -High quality observed stream flow data is necessary for forecasts and drives the quality of the forecasts: • -Short term (10 days) • -Long term (Seasonal Water supply) • -Calibration • -Quality control of stream flow data is often difficult and we make many assumptions • -Often use reservoirs as “truth” , especially in the winter • Observed data helps to keep the model on “track” and verify model states are correct