Download
1 / 22
220 likes | 312 Vues
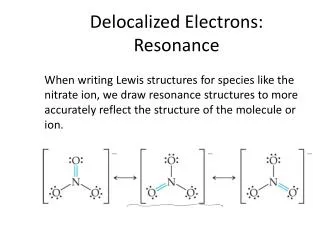
A progress report on the double resonance experiments conducted at Jefferson Lab using mid-infrared and terahertz frequencies, aiming to detect phenomena like rotational relaxation rates in gases and structural dependencies in biomolecules.

E N D
Mid infrared-terahertz double resonance experiments at Jefferson Lab – a progress report. Harvey Rutt, University of Southampton Michael Klopf, Jefferson Lab The ‘JLab Team’! SR User Meeting, 14th September 2007
What are we trying to do? THz JLab CSR source On this Sample Easy Mid IR Glowbar (initially) Detect the influence of this….
Novelty • Fully frequency multiplexed in the MIR • We should see double resonance wherever it occurs in the MIR • CSR source has the power to do broad band excitation; PRF changeable • pS excitation • Precise, absolute phase information
Reminder…. THz JLab CSR source On this Sample Easy Mid IR Glowbar (initially) Detect the influence of this….
In reality: MIR THz
The CSR Source Major interests 74.9 MHz 37.4 MHz 18.7 MHz 9.4 MHz 4.7 MHz
THz THz Why? – gases. Really a trial run for what follows. But of some interest in measuring rotational relaxation rates, and possibly for some specialist spectroscopic applications. (Actually it wont work for CO2! The molecule must have a permanent dipole moment.)
Why - biomolecules Amide (& other) bands are structure dependent.
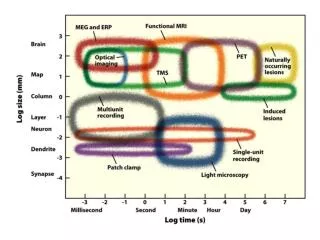
N-H ‘THz mode’ Myoglobin structure – ex Wikipedia The large scale motion of the ‘THz mode’ modulates the environment of the N-H group. Can we detect this?
You need a special MIR detector • Best possible D* - as ever. • Crucially, fast • Normal 77K MCTs are typically~1MHz • Our PRF is MHz to tens of MHz – and we would like low, stable phase shift. • VIGO TEC cooled, ~150MHz, D* >2.5*109cmHz1/2W-1 • Block THz with n-Ge; BaF2 grid polarizer to reduce residual fringes & further reduce THz.
You really need a good purge…. In the MIR, water (1300-1900cm-1) and CO2 (~2340cm-1) are also serious problems. 1m of air
Window material choices. • Diamond; expensive in this aperture • High resistivity oxygen free ‘FZ’ silicon; low THz loss, some mid-IR loss but acceptable • High index leads to extremely strong FP fringes • Wedge angles very large • Brewster angle the only solution.
Signal processing • The signal is frequency multiplexed. • The ‘normal’ absorption spectrum is, as usual in the low kHz region. • The ‘interaction’ spectrum occurs as side-bands on an RF carrier at the FEL PRF • In-phase (absolute!) is the prompt signal • In quadrature is a ‘thermal’ signal
Polarizer MIR Beam THz block How? Phase reference from accelerator MHz region data RF Phase sensitive detector SR844 MIR Detector kHz region data In Phase In quadrature Anti-Aliasing Filter Anti-Aliasing Filter FTIR Spectrometer Nicolet Data acquisition ‘Normal’ FTIR spectrum ‘Interaction’ spectrum
Polarizer MIR Beam THz block Trivial – ground loops……. Low jitter fibre optic MIR Beam Phase reference from accelerator HP Filter MHz region data RF Phase sensitive detector SR844 MIR Detector RF transformer Isolation amp All cables RG58 to RG223 & new BNC kHz region data In Phase In quadrature Anti-Aliasing Filter Anti-Aliasing Filter FTIR Spectrometer Nicolet Ferrite ‘Normal’ FTIR spectrum Data acquisition 60dB better; maybe 15dB to go……………. ‘Interaction’ spectrum
Future work. • Make it work! • Gases • Small proteins etc • Time resolved version using the MIR FEL • Narrow band filter the THz • Or use a THz FEL
Acknowledgements. • The entire JLab team! • Kevin Jordan for extraordinary efforts in improvising purge boxes! • Tom Powers and Pavel Evtushenko for instrumentation help • Gwyn Williams & George Neil for making it possible • Ken Frampton in the ECS workshop for making very awkward shaped bits of stainless steel.