Download
1 / 24
260 likes | 540 Vues
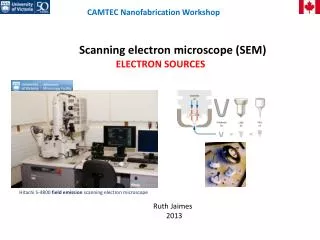
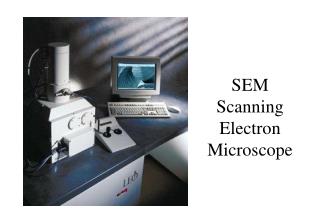
Science Afternoon at NIST Scanning Electron Microscopy (SEM). Brad Damazo , Prem Kavuri , Bin Ming, Kate Klein and Andras Vladar Nanometer Scale Metrology Group Physical Measurement Laboratory. andras@nist.gov. SEM and Imaging System. Frame Grabber Synchronization X Y resolution

E N D
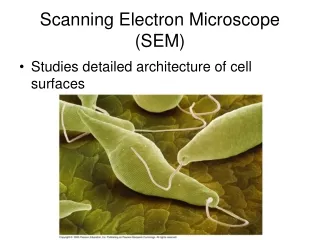
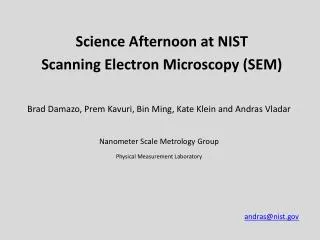
Science Afternoon at NISTScanning Electron Microscopy (SEM) Brad Damazo, PremKavuri, Bin Ming, Kate Klein and Andras Vladar Nanometer Scale Metrology Group Physical Measurement Laboratory andras@nist.gov
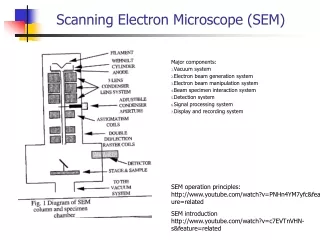
SEM and Imaging System Frame Grabber Synchronization X Y resolution Temporary frame storage PCI bus SEM Computer Fast CPU, lots of RAM, large hard drive Imaging and measurement software Number of frames Time between frames Vacuum FE electron gun Signal detection Focusing lens X & Y scan Sample Sample positioning stage Vibration isolation
Signal Sampling • Bandwidth(B) : difference between the highest (B1) and lowest (B0) frequency • Nyquist (sampling) theorem: an analog signal may be uniquely represented by discrete samples taken at at least twice of the highest frequency (B1) • Sample and hold circuit keeps signal unchanged for the time of conversion • spot sampling (cheaper) or gated integrator (more complex, more $) • Example: for audio CDs the 20 Hz - 20 kHz signal is sampled with 44.1 kHz
AD and DA Conversion • Analog-to-digital conversion: sampling, quantizing, encoding • Digital-to-analog conversion: decoding, filtering • Noise, distortion, non-linearity: resolution dependent for both AD + DA processes • Signal-to-noise ratio (theoretical): 8 bit ADC 48 dB ~250 to 1 12 bit ADC 70 dB ~3100 to 1 • Speed of conversion: 100 ksamples/s 12 bit AD converter 0.1 1024x1024 image/s; 25 ns/pixel 10 Msamples/s 12 bit AD converter 10 1024x1024 image/s; 6 ns/pixel
SEM Image Pixel Resolution Images with higher pixel density might provide more information, and reveal otherwise not perceivable features 512 pixels4096 pixels
SEM Signal-to-noise Ratio Acquiring images over longer time can improve the signal-to-noise ratio, and more details can be discerned. 2 frames 8 frames 32 frames
Original Image Histogram Stretched Histogram Equalized Contrast Adjustment
-35 gray levels Original image +35 gray levels Brightness Adjustment
Fixing Colors with Histogram Adjustment Original RGB images are from David Bright of NIST
From Images to Measured Data Gray scale image Binary version
Which one is Right? Same sample, different electron detectors upper SE, lower SE, low-loss BE
The Best Way to Interpret the Results • The SEM images are not height maps of the sample • Instead of various fudge factor calculations, it is better put science to work • Monte Carlo modeling and simulation finds the necessary parameters to turn the intensity distribution into real sample geometry information • compensation for the geometry (edge, height, angle, etc.) and material contrast and charging • compute yield and trajectory changes of the SE & BE signal due to sample, sample chamber, detector and charging effects. Data Library • 3-D rendering
From IC Structures to Correct Dimensions Correct SEM measurement De-convolution Model-based edge criterion
Library-based Dimensional Measurements • The unknown integrated circuit structure can be measured by finding the best match chosen from a modeled library of possible shapes. • This method is superior to any currently known and used algorithm
3-D SEM Imaging SEM image pair extraction of height and texture information 3-D rendering http://www.soft-imaging-web.de/
The Best of Scanning Electron Microscopes • The SEM images provide rich information of samples over the millimeter to nanometer scale on a very large and diverse set of samples • Thousands of SEMs are used in research, development and production • 3D and super-high resolution imaging and measurements are becoming reality, so are inexpensive SEMs that can do most of the needed work • For the most demanding applications expensive instruments and laboratories and knowledgeable microscopists are needed