Download
1 / 40
400 likes | 470 Vues
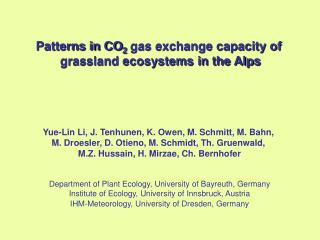
Factors influencing CO 2 exchange in northern ecosystems - a synthesis (kind of). Anders Lindroth Lund University Geobiosphere Science Centre Physical Geography and Ecosystems Analysis Sölvegatan 12, 223 62 Lund, Sweden Anders.Lindroth@nateko.lu.se.

E N D
Factors influencing CO2 exchange innorthern ecosystems - a synthesis (kind of) Anders Lindroth Lund UniversityGeobiosphere Science CentrePhysical Geography and Ecosystems AnalysisSölvegatan 12, 223 62 Lund, Sweden Anders.Lindroth@nateko.lu.se
Part of synthesis work within the Nordic Centre for Ecosystem Carbon Exchange and Its Interactions With the Climate System, NECC (and partly from LUSTRA1) 23 papers to appear in two coming issues of Tellus B Co- authors: Mika Aurela, Brynhildur Bjarnadottir, Torben Röjle Christensen,Ebba Dellwik, Achim Grelle, Andreas Ibrom, Torbjörn Johansson, Leif Klemedtsson, Fredrik Lagergren,Harry Lankreijer, Ola Langvall, Samuli Launiainen, Tuomas Laurila, Magnus Lund, Eero Nikinmma,Mats Nilsson, Kim Pilegaard, Janne Rinne, Jörgen Sagerfors,Bjarni Sigurdsson, Lena Ström, Juha-Pekka Tuovinen, Timo Vesala and Per Weslien 1 LUSTRA; A swedish research programme on developing land-use strategies for reducing emissions in forestry
Part A1 - understanding differences in CO2 exchange betweenforests of different species, age, climate and soils • Part B2 - Productivity and respiration in the forest of similar species but growing in different climates • Part C3 - Factors controling CO2 exchange in peatlands 1Lindroth, A., Lagergren, F., Aurela, M., Bjarnadottir, B., Christensen, T., Dellwik, E., Grelle, A., Ibrom, A., Johansson, T., Lankreijer, H., Launiainen, S., Laurila, T., Mölder, T., Nikinmaa, T., Pilegaard, K., Sigurdsson B. and Vesala, T. 2007. Leaf area index is primary scaling parameter for both gross photosynthesis and ecosystem respiration of Northern deciduous and coniferous forests.Tellus B (accepted) 2Lindroth, A., Klemedtsson, L., Grelle, A., Weslien, P. and Langvall, O. 2007. Net ecosystem exchange, productivity andrespiration in three spruce forests in Sweden. Biogeochemistry (in press). 3Lindroth, A., Lund, M., Nilsson, M., Aurela, M., Christensen, T.R., Laurila, T., Rinne, J., Sagerfors, J., Ström, L., Tuovinen, P. and Vesla, T. 2007. Environmental controls on CO2 exchange of boreal mires in northern Europe. Tellus Bdoi: 10.1111/j.1600-0889.2007.00310.x
Part A - Eight different forests T = -0.9°C P = 305 mmBirch T = -1.0°C P = 429 mmPine T = 3.4°C P = 738 mmLarch T = 1.2°C P = 523 mmSpruce T = 3.0°C P = 700 mmPine T = 5.5°C P = 527 mmPine/Spruce T = 8.3°C P = 730 mmBeech
Daytime analysis Nighttime analysis (Lloyd & Taylor, 1994) • Method: • Day and night separately • One ’normal’ year from all sites • Fco2 only for u*>threshold • Two-week means
Two-week means ofparameter values • air temperature • PAR • VPD • Soil water content • Leaf area index • Species • Age • (Latitude)
What about correlation with latitude?(reminding about Valentini et al., 2000) .and after normalizing for LAI-dependence
After normalization for the LAI-dependency - no correlationwith latitude!
Conclusions: • Ecosystem respiration is well determined by the Lloyd & Taylor equation with only one fitting parameter, the respiration rate at 10°C. • Leaf area index is the parameter that best explaines between stand variations in parametes controling respiration as well as gross photosynthesis • After correction for leaf area, stand respiration shows a weak dependency on stand age
Part B - Three similar forests(all are ca. 40 yrs old spruce stands) T = 1.2°C; P = 523 mmPodzolSoil0-100 C = 7.2 kg m-2 Basal area = 20.7 m2 ha-1 T = 3.4°C; P = 613 mmPodzolSoil0-100 C = 5.9 kg m-2 Basal area = 14.7 m2 ha-1 T = 5.5°C; P = 688 mmGley podzolSoil0-100 C = 23 kg m-2 Basal area = 32.3 m2 ha-1
Method: • Grouping into bi-weekly periods • Filled when u*<threshold- light response fkn for daytime- exp fkn for nighttime • Components separation: Pg = Fcmeas- modelled Reco • Biomass increment from empirical functions within foot- print area • Litterfall & fine root turnover measured in nearby plots
Conclusions: • Norunda is not unique in being a ’looser’! • Large difference in NEP between forests of the same species and age • Unexpected very large losses of soil carbon • Pn is probably not a constant fraction of Pg but varies in the range 30-45%.
Part C - Factors controling CO2 exchange in peatlands T = -1.1°C; P = 474 mmSub-arctic mesotrophic fen T = 1.2°C; P = 523 mmBoreal oligotrophicminerotrophic mire T = 3.0°C; P = 713 mmBoreal oligotrophic fen T = 6.2°C; P = 700 mmTemperate ombrotrophic bog
Fäje myrThe source area is dominated by a mosaic of hummocks, lawns and carpets
Siikaneva The source area is dominated by sedges and moss carpet
Degerö Stormyr The source area is dominated by a lawn plant community
KaamanenThe source area is dominated by the hummock-hollow microstructure
Questions asked: • Similarities/differences in seasonal dynamics of NEE, GPP & Reco • Similarities/differences in responses of respiration and photosynthesis to enviromental parameters among different types of Nordic peatlands? • What are the major controls of CO2 exchanges?
Methods • Half hourly fluxes of CO2 net exchange between peatland surface and atmosphere measured by eddy covariance under well-mixed conditions (u*>0.1) • The same method was used at all sites (i.e., Euroflux methodology) • One year of data separated into DAYTIME and NIGHTTIME periods • Datasets were further divided into 14-days periods for parameter estimations • GPP was estimated using fitted bi-weekly light-response functions • Total ecosystem respiration during daytime was estimated as the difference between measured NEE and estimated GPP • De-trending of seasonal effects were made using dummy variable
F Eddy Covariance Method
Relationship between GPP, Reco and environmental variables Independent variables: - GPP - Reco - GPP_res- Reco_res- GPP_res_norm- Reco_res_norm Dependent variables: - Air temperature - Photon flux density (PPFD) - Vapour pressure deficit (VPD) - Water table depth WTDa (whole season) WTDb (period of decreasing WTD)
Normalizing for temperature dependencies New seasonally de-trended and temperature normalized variable: GPP_res_norm = GPP_res/f(T)
Reco = f(Tan) • differences in base respiration and temperature sensitivity due to litter quality?
Regression analysis Fäje myr Degerö Kaamanen Siikaneva
Fäje myr Degerö Kaamanen Siikaneva
Today Reco is 50 - 80% of GPP - how sustainable is this relationship?
What about other peatlandsin northern hemisphere? NEE (g C m-2)
Conclusions • Apart from a high correlation between the two main components themselves, i.e., respiration and photosynthesis, temperature was the single most important variable in explaining the variation in the component fluxes • Surprisingly, gross primary productivity was, also after de-trending the inherent seasonal variation, found to be more sensitive to temperature than respiration for the actual sites • Water table depth explained variations in respiration and photsynthesis only during consistent drying up phases • Wetlands seems to be small but consistent sinks