Exploring Cellular Response to Doxycycline Treatment Using siRNA Technology
Investigating the impact of doxycycline on gene expression through siRNA manipulation. Analyzing polyamine concentration and cell viability. Research involves RT-PCR and molecular studies on cancer cell lines.


Exploring Cellular Response to Doxycycline Treatment Using siRNA Technology
E N D
Presentation Transcript
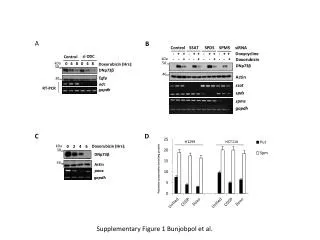
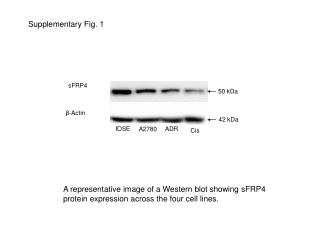
A B Control SSAT SPDS SPMS siRNA - + + - + + - + + - + + Doxycycline si ODC Control - - + - - + - - + - - + kDa Doxorubicin 58 kDa 0 4 8 0 4 8 Doxorubicin (Hrs): DNp73β 58 DNp73 46 Actin Egfp 30 odc ssat RT-PCR gapdh spds spms gapdh C D H1299 HCT116 kDa Doxorubicin (Hrs): 0 2 4 6 58 DNp73β 46 Actin Polyamine concentration (nmol/mg protein) paox gapdh Supplementary Figure 1 Bunjobpol et al.
A C Vector FosB kDa CHX (Hrs) 0 1.5 3 4.5 0 1.5 3 4.5 58 DNp73β 46 FosB 30 46 Actin Vector JunB CHX (Hrs) 0 1.5 3 4.5 0 1.5 3 4.5 DNp73β JunB Actin mutant paox % DNp73 remaining B D RLU kDa kDa siRNA Vector c-Jun 58 58 Time after cycloheximide (Hrs) % DNp73 remaining CHX (Hrs) 0 2 4 6 0 2 4 6 30 DNp73β 30 46 46 c-Jun Time after cycloheximide (Hrs) Actin % DNp73 remaining Time after cycloheximide (Hrs) Supplementary Figure 2 Bunjobpol et al.
si Az1 Control Vector c-Jun c-Jun Vector FosB FosB DNp73β A B c-Jun FosB Actin kDa kDa 58 az1 gapdh 17 30 46 46 30 46 DNp73β/Actin (% vector control knockdown ) μM MDL 72527 0 200 300 Az1 (p) Actin Vector c-Jun FosB c-Jun FosB Vector Az1 Control siRNA Supplementary Figure 3 Bunjobpol et al.
A Thyroid Thyroid B-cell leukemia Prostate Gastric 3 2 2 2.5 2 μM MDL 72527 0 50 100 150 200 250 DNp73β 1 1 1.5 0 Normailzed paox expression units Actin 1.5 SHSY5Y DNp73β 0 0 1 -2.5 0 0 Normal (n=4) Tumour (n=14) Normal (n=74) Normal (n=9) Tumour (n=9) Normal (n=8) Normal (n=31) Tumour (n=4) Tumour (n=147) Tumour (n=13) Oncomine boxed plots B kDa 58 46 Supplementary Figure 4 Bunjobpol et al.
A SHSY5Y DNp73β Vector μM Doxorubicin 0 0.25 0.5 0 0.25 0.5 - MDL 72527 + MDL 72527 +MDL +MDL Caspase3 activity SHSY5Y pcDNA SHSY5Y DNp73β C B pcDNA DNp73β kDa ΔOD400nm 58 DNp73 Propidium Iodide 46 Propidium Iodide Actin +MDL +MDL HCT116 % Ann. V+/PI+ SHSY5Y pcDNA SHSY5Y DNp73β Annexin V - FITC Annexin V - FITC D HCT116 Vector DNp73β CDDP - + - + Control Control sipaox Control sipaox HCT116 pcDNA HCT116 DNp73β sipaox Supplementary Figure 5 Bunjobpol et al.