Comprehensive Analysis of pI and Molecular Weight in Genomic Variants
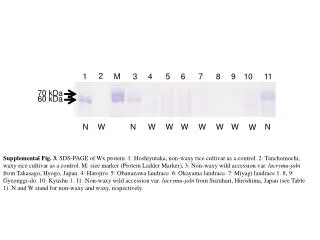
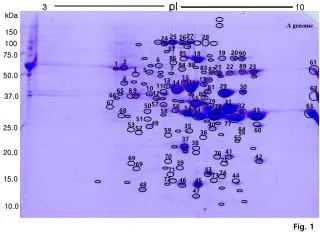
This study presents an in-depth analysis of isoelectric points (pI) and molecular weights (kDa) across various genomic variants. We explore data derived from multiple organisms, highlighting significant findings linked to protein behavior and stability across different conditions. Our results are visually supported by figures illustrating the variation in pI and molecular weights, facilitating understanding of protein interactions. The research aims to enhance genomic knowledge related to proteomics and contribute to the fields of molecular biology and bioinformatics.

Comprehensive Analysis of pI and Molecular Weight in Genomic Variants
E N D
Presentation Transcript
pI 3 10 kDa A genome 150 27 25 28 26 24 100 87 20 19 85 90 18 75.0 86 6 2 61 1 84 88 89 22 23 21 83 7 82 3 5 50.0 15 4 17 13 16 14 11 29 30 81 10 62 65 8 9 12 80 66 37.0 55 79 31 67 57 50 32 63 56 78 54 34 33 68 58 51 49 77 40 53 35 25.0 52 64 60 59 36 65 37 38 20.0 41 76 70 42 69 75 39 69 43 71 74 73 44 15.0 72 46 45 48 47 10.0 Fig. 1
pI 3 10 kDa 15 150 14 13 100 12 B genome 13 16 5 6 75.0 11 1 4 18 17 19 21 3 8 20 22 23 2 7 9 24 50.0 32 10 31 30 28 29 26 51 27 25 33 34 36 37.0 35 52 37 53 38 49 25.0 40 39 50 41 20.0 54 46 42 48 15.0 55 47 43 45 44 10.0 Fig. 1
pI 3 10 2 4 1 3 kDa D genome 10 11 17 8 9 16 7 5 6 15 150 12 13 14 17 100 18 31 20 19 27 30 28 75.0 22 21 23 50.0 29 24 1 2 25 26 8 10 9 43 38 46 44 45 37.0 39 52 3 12 42 11 60 51 59 47 50 4 53 61 25.0 62 13 49 65 64 14 54 48 57 58 5 63 67 15 68 20.0 16 6 17 18 27 29 30 26 15.0 28 20 33 34 32 31 21 23 25 7 20 19 24 10.0 Fig. 1 22