Propagation & Solar Activity
Propagation & Solar Activity. 1st hop. 2nd hop. By 19AT072 Jean-Paul. Agenda:. History of Propagation Service Center <PSC> Propagation Modes The Ionosphere Solar Terrestrial Activity Special Propagation Modes Preparing forecasts ???. 1.<PSC> history:.

Propagation & Solar Activity
E N D
Presentation Transcript
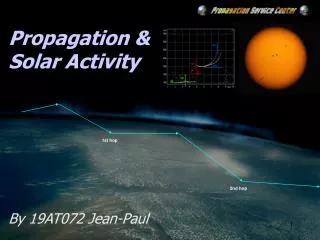
Propagation &Solar Activity 1st hop 2nd hop By 19AT072 Jean-Paul
Agenda: • History of Propagation Service Center <PSC> • Propagation Modes • The Ionosphere • Solar Terrestrial Activity • Special Propagation Modes • Preparing forecasts • ???
1.<PSC> history: • Problems getting through QRM and pile ups • Understanding HF propagation would offer an advantage • Studying scientific material (library / internet) • Experiments and detailed logging of daily conditions • The need to share information (19AT’s 11-news) • Daily e-mails to WWDX mailinglist
1.<PSC> history: • Build a website for personal use only, with all kind of indexes on one page. • Upgrading by providing extended forecasts and propagation alerts. • 1998: official launch of the WWDX <PSC> website • Upgrade with a study center (WWDX College) • Other priorities • <PSC> went asleep • 2007: <PSC> revived
2. Propagation Modes: • Groundwaves: • Can travel only at fixed distances • Max. distance depends on antenna height • Geological influences • Horizontal polarization is favourable
2. Propagation Modes: • Tropospheric waves: • Travel across the first 10km of the atmosphere • Quiet weather causes sharp differences between air layers in humidity and/or temperature • These temperature or humidity differences are called “inversions” • Inversions can bend radiowaves, especially VHF and higher • On 11m can increase distances up to 250km and more
2. Propagation Modes: • Ionospheric waves: • Travel between the upper (80-500km) part of the atmosphere and the Earth’s surface • Ionized layers of air bend radiowaves back to Earth • Ionization mainly depends on X-ray and UV radiation from the sun (sunlight) • Ionospheric radiowaves are bent up to 50MHz, and in some occasions beyond 70MHz • On 11m can increase distances up to 20000km and more
3. The Ionosphere: • D-layer: • Altitude between 50km and 80km • Only absorbs radiowaves (most effect on MF and low HF band up to ±7MHz) • Is ionized by X-rays • Peakes at noon (max. absorbtion) • Appears shortly after sunrise, disappears shortly after sunset
3. The Ionosphere: • E-layer: • Altitude between 90km and 130km • Reflects radiowaves upto ±5MHz • Absorbs radiowaves above ±5MHz • Is ionized by UV-rays • Peakes shortly after noon • Appears during sunrise and disappears during the night
3. The Ionosphere: • F1-layer: • Altitude between 160km and 250km • Reflects radiowaves upto ±10MHz • Is ionized by UV-rays • Peakes already in late morning throughout the afternoon • Merges with the F2 layer during the night.
3. The Ionosphere: • F2-layer: • Altitude between 250km and 450km • Reflects radiowaves upto ±70MHz • Is ionized by UV-rays • Peakes in late morning and late afternoon. Reaches close to max. ionization already shortly after sunrise. • Merges with the F1 layer during the night to form the F-layer
3. The Ionosphere: • Ionization and ions: • The atmosphere at high latitudes consists out of simple atoms like Oxygen, Hydrogen, Nitrogen, etc. • Atom consists out of neutrons, protons and electrons • X-rays and UV-rays make the electrons break free from their orbit around the core (protons + neutrons) • Electrons become ions which are electrically charged • These energized ions bend radiowaves • More ions, the higher frequency radiowaves is reflected • The denser the air, the faster ions recombine into atoms
4. Solar Terrestrial Activity: • Sunspots: • Cold areas on the sun’s surface comparable with Earth’s volcanoes. It’s eruptions are called Solar Flares • Produced by strong magnetic forces on the sun’s surface • Sunspots produce much X-ray and UV radiation • Randomly appear, but maximum peaks in 11-year cycle • Appear as “regions” of activity • Radiation causing ionization is measured in Solar Flux index (from 64 up to 250 during a maximum) at 2800MHz
4. Solar Terrestrial Activity: • Sunspot classification: • Identified by SEC (NOAA Space Environtment Center) as they appear, with a region number. • Regions not numbered yet by SEC, but spotted by <PSC> are numbered with P-number. • Classified by it’s magnetic forces from Alpha (weak) , Beta and Gamma to Delta (very strong) • Classified by the type of sunspots with three lettercode, for example AAX or DSO.
4. Solar Terrestrial Activity: • Solar Flares: • Produce high levels of radiation (X-ray and UV) • Ejections of large masses of charged particles called Coronal Mass Ejection (CME) • The more magnetically complex the sunspot region, the larger the solar flares it can produce • Measured in the level of X-rays ranging from A, B, C, M to X, for example C3.2 (small) or X8.5 (very large) • A large flare can cause ionoziation to increase shortly
4. Solar Terrestrial Activity: • The Geomagnetic Field (GMF): • Earth’s rotating iron core produces a magnetic field • Magnetic field diverts constant streams of charged particles from the sun, called the Solarwind • Strong at the equator, weak at the poles • Magnetic pole not at same location as geographic pole • Quiet GMF allows high ionization grades • The status of the GMF is measured with the K-index (3 hourly) ranging from 0 (inactive) to 9 (extreme severe storm). The daily status is measured with the A-index.
4. Solar Terrestrial Activity: • The Geomagnetic Poles and Geomagnetic Equator:
4. Solar Terrestrial Activity: • CME: • Cloud of highly charged particles • Travels from the Sun to Earth in 12 to 72 hours. • Partial Halo (partially Earth directed) and Full Halo (fully Earth directed). • Presses down the GMF as Solar Wind speed increases • Black out of HF propagation as GMF becomes unstable • Divertion of particles onto the polar areas where GMF is weak (Aurora appears, as charged particles bombard the atmosphere). K-index can go up from 5 to 9
4. Solar Terrestrial Activity: • CME hitting Earth:
4. Solar Terrestrial Activity: • Coronal Hole: • The Corona is the Sun’s atmosphere • A hole in the Corona means charged particles can find their way out speeding up Solar Wind • As Solar Wind speed increases, GMF is pressed down • Possible black out of HF propagation as GMF becomes unstable (K-index can reach upto 5-6) • Divertion of particles onto the polar areas where GMF is weak (Aurora) • Not as strong as CME
Solar Terrestrial Activity: • Cycles and Seasons: • The number of sunspots reaches a maximum every ± 11 years. This is called the Sunspot Cycle • So every ±11 years there is also a minimum • D-layer and E-layer strength are highest during summer (max. absorbtion) • F-layer strength is highest during winter • Sun rotates around it’s axis in 27 days, adding a 27-day cycle
4. Solar Terrestrial Activity: • Sun’s 27-day cycle:
5. Special Propagation Modes: • Es (Sporadic-E): • Ionospheric propagation via Es-layer at 80-130km altitude • Distances from 500-1800km “single hop” • Produces relative strong signals • MUF can reach up to 150MHz and more • Peaks during spring/summer and mid-winter • Appears randomly but peaks late morning and late afternoon
5. Special Propagation Modes: • TEP (Trans Equatorial Propagation): • Ionospheric propagation via highly ionized and high altitude part of the F-layer • Double reflection in the ionosphere • Works only passing the magnetic equator • MUF can reach up to 400MHz and more • Peaks late afternoon well into the evening
5. Special Propagation Modes: • Aurora: • Ionospheric propagation via highly ionized and vertically orientated clouds • Clouds work like cracked “mirrors” • Only appears on higher latitudes • Caused by geomagnetic storms (CME etc.) • MUF can reach up to 400MHz and more • Signals very QSB • Sometimes visible at night
Aurora Station A QTH: Amsterdam Station B QTH: Hamburg
5. Special Propagation Modes: • Backscatter: • Ionospheric propagation via F2-layer • Signal is scattered back when it reflects of the F2-layer or Earth’s surface ???? • Allow to work into the “blind zone” • “Early morning beacon” • “Hollow” modulation like someone is talking into a large pipe or barrel • Directional antenna and some Tx power needed
6. Preparing forecasts: • How: • Continuously monitor solar activity • Continuously monitor propagation worldwide (make use of clusters) • Make links between changes in solar activity and their effects on propagation • Join the PSC team as an Observer, and become one of the Researchers or Forecasters
6. Preparing forecasts: • Sources of information: • SOHO website • DXLC website (large archive) • SEC website
6. Preparing forecasts: • SOHO spacecraft images:
6. Preparing forecasts: • SOHO EIT (extreme UV) images: Bright areas are active regions. The brighter and larger the area, the more activity.
6. Preparing forecasts: • SOHO MDI Magnetogram images: Displays the magnetic forces within active regions. The more dense and larger these black/white areas, the stronger the magnetic forces, unleashing solar activity.
6. Preparing forecasts: • SOHO Lasco C2 images: Displays the Sun’s Corona (atmosphere). Activity on the sun’s limbs and backside can be seen, as well as solar flares and CME’s. Observe the flames shooting out.
6. Preparing forecasts: • SEC Space Environment Center: X-ray level. Peaks are caused by Solar Flares. High X-ray levels (> C5) causes high absorption in D-layer. If X-ray level rises, usually Solar Flux rises along.
6. Preparing forecasts: • SEC Space Environment Center: K-index. 3-Hourly geomagnetic index. High indexes (>5) mean stormy conditions, which is bad for the ionosphere.
7. <PSC> moving forward: • How: • Make <PSC>’s services more accessible • Cooperate with an independent organisation • Expand the team worting on observations, research and forecasts. • Make it a worldwide thing • <PSC> proudly presents the new <PSC>
Thank you !!! • - Better forecasts - • - Better info - • - More accessible - - For everyone - - Independent from any club - - By proud DX’ers for proud DX’ers -
![G3 - RADIO WAVE PROPAGATION [3 Exam Questions - 3 Groups]](https://cdn0.slideserve.com/484375/g3-radio-wave-propagation-3-exam-questions-3-groups-dt.jpg)
![G3 - RADIO WAVE PROPAGATION [3 Exam Questions - 3 Groups]](https://cdn1.slideserve.com/3333950/g3-radio-wave-propagation-3-exam-questions-3-groups-dt.jpg)