
Variability Control Chart and CQI: Exploring Measures, Expected Deviations, and Process Improvement
E N D
Presentation Transcript
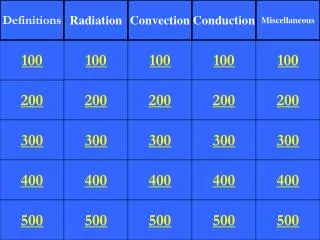
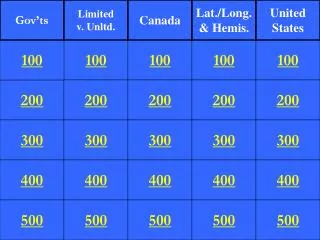
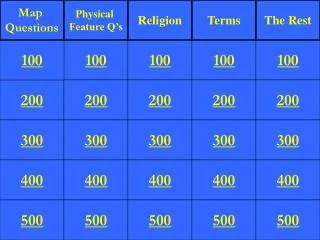
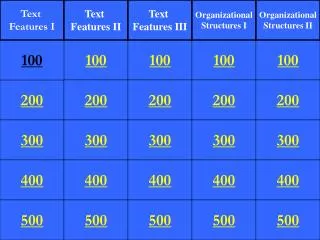
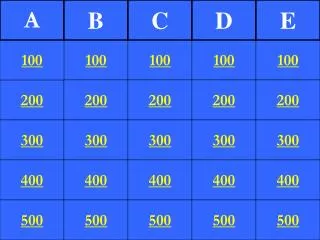
Variability Control Chart CQI Personal Imp. Catch All 100 100 100 100 100 200 200 200 200 200 300 300 300 300 300 400 400 400 400 400 500 500 500 500 500
Variability for 100 Points Which of the following is not a measure of variability in the process: Average, Range, Standard Deviation, Median, Fourth Spread
Average and median are not measures of variability of the process
Variability for 200 Uses Expected Deviations
Variability for 300 What is wrong with this chart?
The control limits should have been calculated from the pre-intervention period as it has less variability.
Variability for 400 What is the Fourth Spread for days between errors?
Ordered days between error: 1, 6, 7, 7, 11, and 23 days Median=7, UF=11, LF=6 Fourth Spread=5 days
Variability for 500 What is expected deviation for Time 3?
What is the look on student’s face on first day of class after being told to use Excel to make a control chart
What is a process that has changed from pre-intervention to post-intervention period.
Control Chart for 400 Show that the 8th week is different
CQI for 100 PDCA
CQI for 200 perspectives solutions two no customer no embedded voice least two at blamed use employee
Use customers voiceNo employee blamedNo embedded solutionAt least two perspectives
CQI for 300 Don’t study what is wrong with current situation
CQI for 400 Takes 13 and 17 months
From the identification of the problem to the completion of the first pilot improvement takes ~ 17 months. From the first meeting of the team to the end of the first pilot takes ~13 months.
CQI for 500 1-Select the best 2-Meet before the meeting 3-Redo the list of ideas at meeting 4-Rate ideas 5-Discuss major differences 6-Ignore small differences
Personal Improvement for 100 Stand up desk, reduced heat in the house by 1 degree, sell the television
What are examples of system changes that could increase exercise
Personal Improvement for 200 Which matters more, a process owner or a buddy with same resolution
In Continuous Self Improvement the process owner is more important because his/her consent is needed to change the environment
Daily Double CQI for 300 x 2 Listen and tell what Alemi will suggest to change in this personal improvement http://www.youtube.com/watch?v=q-rEvoLZ4pY
Scores for extent of system changeControl chart based on less variable pre-intervention period
CQI for 400 What chart is appropriate for a personal improvement to increase a patient’s preventive intake of aspirins
Since medications are either taken or not taken, and there are one data point for each period, then time between chart is most appropriate
Personal Improvement for 500 How many times were students who changed their environment more likely to accomplish their resolution than students who put more effort into keeping up with their plans
Changing the environment improved the odds of success by 1.93 times more than relying on one's motivation.
Catch All for 200 Uses ICD9 codes & measures severity
Computerized severity • Disease staging
Catch All for 300 Meet before the meeting Postpone evaluation of ideas
What are two critical steps to improve team meeting processes
Catch All for 400 If t-value of 10 case is 1.8 and t-value of 8 cases is 1.2, what is the t-value of 9 cases
Catch All for 500 When would six sigma calculations, popular in other industries, fail to work within health care.