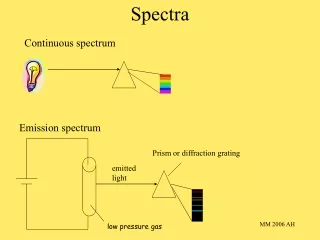
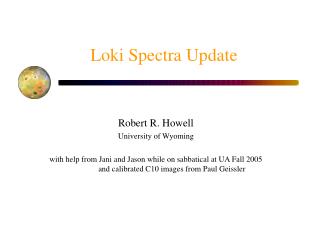
Loki Spectra Update
Loki Spectra Update. Robert R. Howell University of Wyoming with help from Jani and Jason while on sabbatical at UA Fall 2005 and calibrated C10 images from Paul Geissler. Overview. Loki-NIMS paper (Howell & Lopes) submitted to Icarus in February

Loki Spectra Update
E N D
Presentation Transcript
Loki Spectra Update Robert R. Howell University of Wyoming with help from Jani and Jason while on sabbatical at UA Fall 2005 and calibrated C10 images from Paul Geissler
Overview • Loki-NIMS paper (Howell & Lopes) submitted to Icarus in February • Had hoped to have revisions done before meeting – not quite • Probably will be submitted in next couple weeks • 1997 Flow model correction for Pele rates ( ~May Icarus) • Updates to volatile work: Concentrating on obtaining calibrated spectra in Loki region from Galileo SSI (and eventually Voyager – for UV) • Update from spectra shown at Boulder workshop • Previous spectra all ratioed to reference region (white “island”) • Paul Geissler provided calibrated images last summer • I’ve learned how to produce those – and how to processes and register with ISIS to minimize “averaging” effects • Have calibrated spectra of selected regions around Loki • See spatial effects in “Band depth images” for 0.9 μm (pyroxene) • See spatial effects in “BDR” for “feature” 0.757 μm • Volatile work and spectra mentioned briefly in Loki-NIMS manuscript • Will move that to 2nd paper – submitted by end of summer
Flow model paper corrections • 1997 Flow model correction for Pele rates: May(?) Icarus • As I mentioned to several people – some problem in basalt flow areal rates for Pele • Theory not affected. Loki, Ulgen, Amaterasu checked and also OK • Pele areal rates (m2/s) were too high as published by factor of ~12 • Caused by wrong scale factor in IRIS FOV (or equivalently distance) • Affects rates, but not time scales (which only depend on SHAPE of spectra) • So fast overturn times still apply – i.e. lava lake • Corrected rates: (1000, 1600, 2800 m2/s) for (4, 1, ¼ day) time scales • Product gives area of hot spot/flow: (also too high by 12) 138 km2 (equivalent to 13 km diameter circle) • Dark region in Fig. 2 of Radebaugh 2004) is 250 km2 • Just discovered yet another correction: • Minor part of paper is applying flow model to sulfur • Clear that S flows don’t work – cool too quickly – rates too high • Discovered I’d used an unrealistically large K for sulfur (3-10X) • With better sulfur K flow rates even larger, time scales even shorter • With new numbers sulfur works even more poorly than before
C10 Calibrated images (from Geissler) with ROI’s Last year just ratioed to island ROI 0 Red “rim” regions ROI 5,6 Dark “patera” regions ROI 4, 7
Comparison with Geissler 1999: Dark regions ROI 7: Dark at 0.4 μm mixed with S, not SO2
Comparison with Geissler 1999: Red Rims Red rims match Geissler 1999 Red volcanic regions. (0.76 feature?)
Band depth map for 0.888 μm filter (pyroxene) • Grey scale from 0.888 μm image • Red = 0.888 μm absorption • Blue = 0.888 μm emission • Ignore rim effects for now • Do see sublte variations in band strength • Weak in SE corner • Stronger near inner and outer margins • Present (weaker) in ROI 7 and “fissure”
Band depth map for 0.757 μm filter (unknown) • Grey = 0.757 μm image • Red = absorption • Blue = emission • Artifacts from limited spectral resolution • 0.888 μm absorption produces false adjacent channel emission • Do see real “absorption” in 0.757 μm band around rim of patera
Spectra of groups of pixels: Rims • 0.757 μm feature “real
Spectra of groups of pixels: Patera • 0.757 μm feature “real
Summary • Subtle variations in spectra around Loki • Rims look very similar to “red” regions • Short chain S • 0.9 μm “pyroxene” absorption variable within patera • 0.757 μm unknown absorption present in some “red” rim regions