Download
1 / 18
180 likes | 275 Vues
Explore how the Solar Dynamics Observatory (SDO) utilizes high-resolution spectroscopy for helioseismology and magnetic fields, observing ripples and polarization properties on the Sun's surface. With advanced technology to capture detailed interactions of magnetic fields and plasma, SDO provides crucial data on solar variations that impact Earth. Learn about SDO's instruments, mission operations, and scientific goals.

E N D
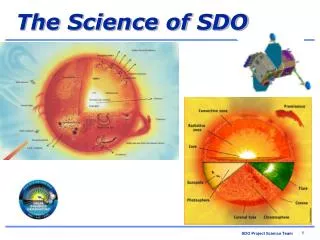
Sensing the Sun from Space • High-resolution Spectroscopy for Helioseismology and Magnetic Fields • Observe ripples and polarization properties on the surface of the Sun • Sound waves require long strings of continuous data to interpret—satellites may have no day/night cycle • Convection zone velocities and magnetic fields require high spatial resolution • Coronal Imaging • Observe bright plasma in the corona at ultraviolet wavelengths —can’t be seen from ground • Temperatures of the plasma range from 50,000 K to >3 million K • High spatial resolution to see the detailed interaction of the magnetic field and the plasma • High time resolution is required to see how those features develop • Spectral Irradiance • Measure the total energy in narrow wavelength bands • Measure from space to avoid the twinkling and absorption of atmosphere • Essential for models of the ionosphere • Coronagraphs • Light scattered from the corona and solar wind • Track material as it exits the Sun and moves through the solar system • Energetic Particles and Fields • Point measurements from many platforms to resolve structure
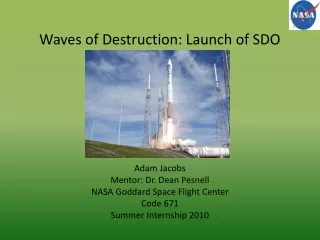
The SDO MissionNASA/LWS Cornerstone Solar Mission • NASA and three Instrument Teams are building SDO • NASA/ Goddard Space Flight Center: build spacecraft, integrate the instruments, provide launch and mission operations • Lockheed Martin & Stanford University: AIA & HMI • LASP/University of Colorado: EVE • Launch is planned for August 2008 on an Atlas V EELV from Cape Canaveral • SDO will be placed into an inclined geosynchronous orbit ~36,000 km (21,000 mi) over New Mexico for a 5-year mission • Data downlink rate is 150 Mbps, 24 hours/day, 7 days/week (1 CD of data every 36 seconds) • Data is sent to the instrument teams and served to the public from there • The primary goal of the SDO mission is to understand, driving towards a predictive capability, the solar variations that influence life on Earth and humanity’s technological systems by determining: • How the Sun’s magnetic field is generated and structured • How this stored magnetic energy is converted and released into the heliosphere and geospace in the form of solar wind, energetic particles, and variations in the solar irradiance. Atlas V carries Rainbow 1 into orbit, July 2003.
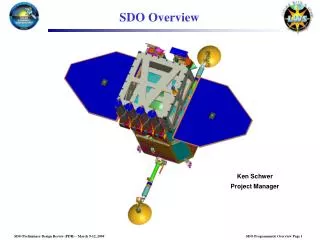
The SDO Spacecraft EVE (looking at CCD radiator and front) AIA (1 of 4 telescopes) The total mass of the spacecraft at launch is 3200 kg (payload 270 kg; fuel 1400 kg). Its overall length along the sun-pointing axis is 4.5 m, and each side is 2.22 m. The span of the extended solar panels is 6.25 m. Total available power is 1450 W from 6.5 m2 of solar arrays (efficiency of 16%). The high-gain antennas rotate once each orbit to follow the Earth. High-gain antennas (1 of 2) HMI (looking down from top)
SDO Operations • Mission operations for SDO are at NASA's Goddard Space Flight Center near Washington, DC. • Communications with the spacecraft are via two radio dishes at NASA's site in the White Sands Missile Range in New Mexico. • The main tasks of the controllers are to keep SDO pointing at the Sun, maintain its inclined geosynchronous orbit, and keep the data flowing. • A scientific team, led by NASA and instrument project scientists, plans and executes programs of observations with SDO’s 3 instruments suites, and analyzes the data. • Unique Operations Mode • Few observing modes: turn it on and let the data flow! • Raw images are sent to the ground for processing • Data is made available soon after downlink; people can use the data in near-real-time • Campaigns and collaborations are coordinated where convenient, but the data is always available TDRSS antennae in White Sands Missile Range
Helioseismic & Magnetic Imager • HMI is the Helioseismic and Magnetic Imager • Built at Stanford University and Lockheed Martin in Palo Alto, CA • Two 4096 x 4096 CCDs • Instrument is designed to observe polarized light to measure the magnetic field • Data will include • Doppler velocities • Oscillations • Local Analysis • Longitudinal magnetograms • Vector magnetograms
HMI Data & Research • Helioseismology and magnetic field • A high-resolution instrument with high data return • Constrains the convection zone and the interior of Sun • Motions responsible for the solar dynamo are seen • Far-side imaging (see the other side of the Sun) • Longitudinal magnetic field shows the strength of B • Vector magnetic field shows strength and direction of B Right: Farside images show the active regions that launched the largest flares ever measured. We can see them on our side at top, continuing around the Sun in the middle and re-appearing at the bottom. The middle view is two weeks after the top and the bottom two weeks later. The velocities under a sunspot show that material moves toward the spot near the surface and away from the spot lower down. It is important to see small details to study this problem.
Atmospheric Imaging Assembly • AIA is the Atmospheric Imaging Assembly • Built at Lockheed Martin Solar and Astrophysics Laboratory in Palo Alto, CA • Four telescopes with filters to select the required wavelength • Filters are at 94, 131, 171, 193, 211, 304, 335, 1600, 1700, and 4500 Å • 4096 x 4096 CCD • Data will include • Images of the Sun in 10 wavelengths • Coronal lines • Chromospheric lines • An image at each wavelength every 8 seconds • Guide telescope for pointing SDO
AIA Data & Research • Images of the Sun in eight bandpasses that cover the temperature range 50,000 K to 3 million K • Images of the corona and chromosphere • The dissipation and redistribution of magnetic field • Coronal seismology, understand the magnetic field by the waves generated along a coronal loop • Combined with the magnetic field of HMI, models of the magnetic field throughout the corona Magnetic field model for September 23, 2004; created from magnetogram data. White lines are loops connecting one part of the Sun to another; green lines are “open”, they do not connect back to the Sun’s surface. AIA will combine their images with the HMI vector magnetograms to build more accurate models.
EUV Variability Experiment • EVE is the Extreme ultraviolet Variability Experiment • Built by the Laboratory for Atmospheric and Space Physics at the University of Colorado in Boulder, CO • Data will include • Spectral irradiance of the Sun • Wavelength coverage 0.1-105 nm • Photodiodes to give activity indices • Full spectrum every 20 s • Information needed to drive models of the ionosphere • Cause of this radiation • Effects on planetary atmospheres
EVE Data & Research • One spectrum every 20 seconds is the primary product • Driver of real-time models of the upper atmosphere of the Earth and other planets • Identify sources of EUV irradiance (with AIA) • Predict the future of EUV irradiance (with HMI) Below (left): Example spectrum from EVE. The elements emitting some of the lines and where the lines are formed in the solar atmosphere is noted at the top. (right) Absorption of radiation as it enters the Earth’s atmosphere. Red areas are altitudes that do not absorb a wavelength, black means complete absorption. The layers of the atmosphere are also listed. All of the radiation measured by EVE is absorbed above 75 km, most above 100 km.
Summary • To understand the Sun we must have data that is high-resolution in space (many pixels), high-resolution in time (many samples), and cover the entire Sun (full-disk) • Velocities and magnetic field in the photosphere • Extrapolate the field measurements into the chromosphere and corona • High time resolution is needed to study the motions in the corona • Space-based measurements can see the ultraviolet radiation that is related to the solar magnetic field but that is absorbed by the atmosphere • Plasma motion and temperature in the corona • This radiation creates the ionospheres of the Earth and other planets • Space-based instruments do not have the day-night cycle of ground-based instruments • Helioseismology studies are more accurate • Changes can be tracked with shorter intervals of time • SDO carries three instruments to help us understand and forecast solar activity • HMI: Helioseismology and Magnetic Imager • AIA: Atmospheric Imaging Assembly • EVE: EUV Variability Experiment • SDO has a large data rate and an open data policy • Data is made available soon after downlink • SDO will allow us to understand and to better forecast solar activity