Download
1 / 18
180 likes | 393 Vues
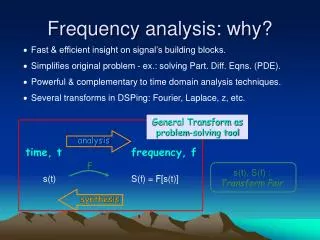
Midwest Regional Flood Frequency Analysis. CPT Ben Bigelow Dr. David Maidment Dr. Edward Holley. University of Texas at Austin. Project Objectives. Develop a GIS-based Map product as a base map Determine a relationship between discharge and drainage area Test on Des Moines River Basin

E N D
Midwest Regional Flood Frequency Analysis CPT Ben Bigelow Dr. David Maidment Dr. Edward Holley University of Texas at Austin
Project Objectives • Develop a GIS-based Map product as a base map • Determine a relationship between discharge and drainage area • Test on Des Moines River Basin • Develop design hydrographs • Assess routing methodology for Des Moines and Mississippi University of Texas at Austin
Midwest Flood Discharge -Duration- Frequency University of Texas at Austin
Test Area • Part of the Upper Mississippi Basin • 11 gages • Mississippi - 4 • Des Moines - 5 • Raccoon - 1 • Iowa-1 • Focused test on Des Moines River University of Texas at Austin
Data Development • 500 m DEM • Delineated drainage areas for each gage • Used CRWR-PREPRO to develop data • Results in an HMS basin file for the Des Moines Basin and for the total test area University of Texas at Austin
Des Moines River • 5 gaging stations • Smoothed frequency curves available for all gages • Van Meter Gage on Raccoon River • Total drainage area is 14038 sq miles University of Texas at Austin
Des Moines DDF Curves University of Texas at Austin
Regional Flood Frequency • Four Variables: Duration (D), Area (A), Frequency & Volume • Mean discharge, Q = Volume/Duration • Q(A, D) = Q(A, 3)*[Q(D)/Q(3)] where • Q(A, D) is the design mean discharge from area A for the maximum D day period in the flood • Q(A, 3) is the discharge-area function for the maximum 3-day period in the flood • Q(D)/Q(3) is the discharge-duration ratio University of Texas at Austin
Area Function Comparison Mississippi River Basin Des Moines River Basin • Y: Daily Average flow for maximum 3-day volume X: Drainage Area • Regression used to find best fit function • Mississippi and Des Moines clearly trend differently • Inadequate data to determine trend from 15000-75000 square mile drainage area University of Texas at Austin
Duration Function Comparison Mississippi River • Y: Average [ Q(D)/ Q (3)] where D = 1,3,10,15 & 30 days • X: Duration • Spread of the data points are the observed values at gages Des Moines River University of Texas at Austin
Flow Determination (cont) • Use analytical functions to estimate the discharge for other durations and compare to values from frequency analysis at individual gages • Q(A,D) = Q(A, 3)*[Q(D)/Q(3)] • The analytical functions were tested for both the large (Mississippi) basin (4 gages) and the small (Des Moines) basin (6 gages). University of Texas at Austin
Des Moines Discharge Comparisons Actual Values: Blue points Analytical Function: Red Line University of Texas at Austin
Mississippi Discharge Comparisons University of Texas at Austin
Design Discharge Profile, Des Moines River 1-day, 100-year peak flow Raccoon River University of Texas at Austin
Design Discharge Profile, Mississippi River Iowa-Cedar Rock Des Moines 1-day, 100-yr peak flow Des Moines Iowa-Cedar Rock University of Texas at Austin
University of Texas at Austin Conclusions • Discharge,Q is a function of duration, D, area, A, and frequency • choose a frequency (100 years) • choose a reference duration (3 days) • Q(A, D) = Q(A, 3) * [Q(D)/Q(3)] • tests on Des Moines basin (6 gages) and Upper Mississippi (4 gages)
University of Texas at Austin Conclusions • Within a river basin (Des Moines or Upper Mississippi) • discharge-area function is nearly linear • discharge-duration ratio is consistent among all gages • These functions are scale dependent and different for Mississippi as compared to Des Moines
University of Texas at Austin Conclusions • Flow profiling tool allows continuous plot of design discharge along the river