### Understanding Commensalism and Mutualism: Population Dynamics and Growth Interaction ###
This article explores the concepts of commensalism and mutualism in ecological interactions. Commensalism refers to one species benefiting while the other remains unaffected, while mutualism indicates a mutually beneficial relationship. We emphasize the necessity of measurable benefits at the population level, showcasing how an increase in one species can uplift the per capita growth rate of the other. We present a graphical approach analyzing the interaction dynamics, isoclines, and equilibrium conditions between two species, with an emphasis on how these relationships influence stability and growth in ecosystems. ###

### Understanding Commensalism and Mutualism: Population Dynamics and Growth Interaction ###
E N D
Presentation Transcript
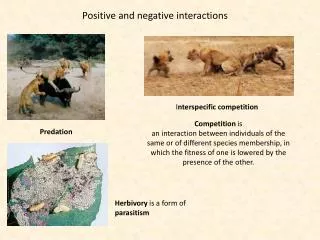
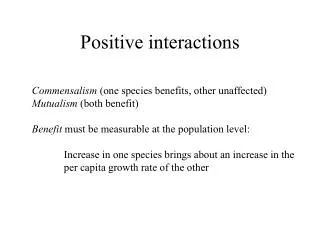
Positive interactions Commensalism (one species benefits, other unaffected) Mutualism (both benefit) Benefit must be measurable at the population level: Increase in one species brings about an increase in the per capita growth rate of the other
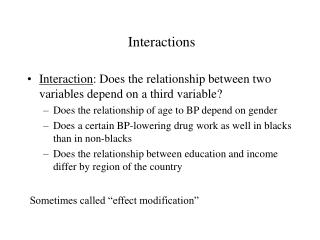
Graphic approach to Commensalism: the host Combinations of densities of both species are shown on the graph. Arrows show regions that permit growth or force declines on Species 1. The vertical line represents the combination of N1 and N2 that will result in N2 being constant-- the isocline for Species 2. Since Species 1 is not affected by Species 2, that line is vertical N2 K1 N1
The Benefit Species 2 benefits from species 1. We can envision this resulting from more resources, permitting more species 2 to be supported on a long-term basis. What is shown here is a facultative situation-- Sp. 1 is good for 2, but not essential. This is shown by K2: even with zero for N1, Species 2 can still grow to a carrying capacity. However, life is better with Sp. 1 present, and the equilibrium for species 2 should increase as N1 increases, as shown by the upward-slope of Species 2’s isocline. N2 K2 N1 The isocline shows the combinations of N1 and N2 that will keep N2 constant. The region above shows density combinations that force declines in N2, and growth of N2 is possible in the region below the isocline
Changes of both species Now that we’ve identified the density combinations that permit equilibrium, growth and decline, we can predict what will happen when the species interact by combining the two previous graphs: No matter where we start, we always end up at the intersection of the two isoclines-- Global stability N2 K2 K1 N1
An obligatory commensalism If some minimum density of the host is necessary for the commensal to grow at all, then its isocline might bend to pass through the axis of the host. The isoclines might be arranged like this. N2 Note that it is possible for N2 to go to zero, if host density is low enough. K1 N1 Minimum threshold of N1 needed for sp 2 togrow
Isocline for Species 1: N2 K1 N1
Isocline for Species 2: K2 N2 K2 N1 a21